
Identify pulsar candidates from signal summaries
Classify HTRU2 candidates from eight integrated pulse-profile and dispersion-measure statistics. The supplied network is a signal-screening benchmark evaluated on 3,579 held-out records.
1. Scientific objective
Radio-astronomy screening produces many candidates that need prioritization. The model learns the HTRU2 annotation from summary statistics, supporting candidate ranking and error inspection.
Signal screening
Rank candidate patterns for scientific review.
Rare-class errors
Inspect missed candidates and false positives.
Reproducibility
Retain the saved split and signal-feature definitions.
2. Data and provenance
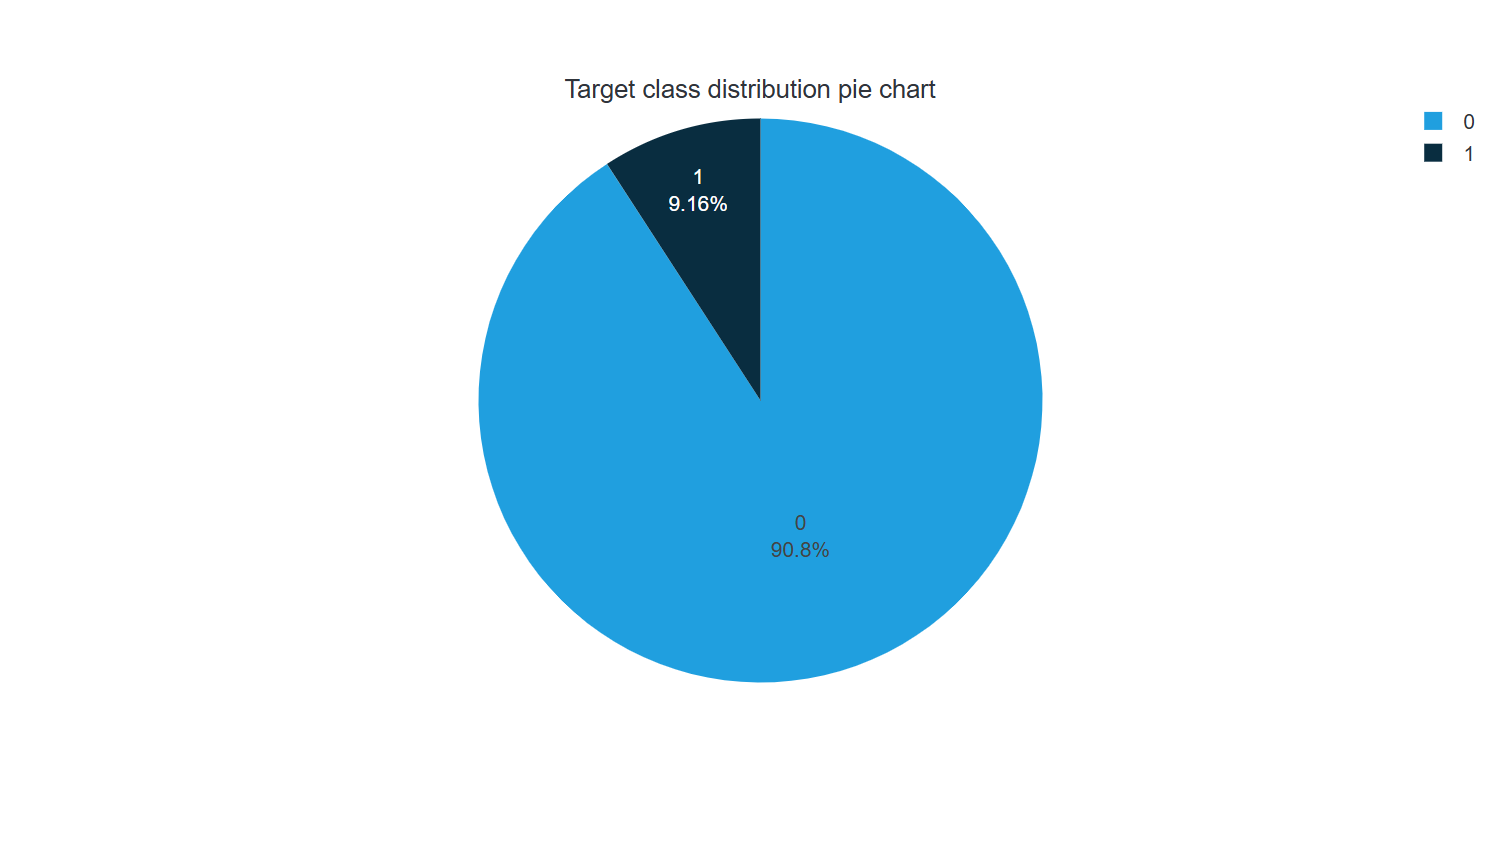
The UCI HTRU2 dataset contains 17,898 records with eight numeric features and one binary class. The saved positive class is 1, representing a pulsar candidate.
Source: HTRU2. Dataset license: CC-BY-4.0. The downloadable ZIP includes the adapted data and attribution notices.
| Dataset measure | Saved value |
|---|---|
| Analysis unit | candidate record |
| Records | 17,898 |
| Raw variables | 9 |
| Encoded model inputs | 8 |
| Model outputs | 1 |
| Training roles | 10740 |
| Validation / selection roles | 3579 |
| Testing roles | 3579 |
| Unused roles | 0 |
| Field | Role | Type | Categories |
|---|---|---|---|
| profile_mean | Input | Numeric | |
| profile_stdev | Input | Numeric | |
| profile_skewness | Input | Numeric | |
| profile_kurtosis | Input | Numeric | |
| dm_mean | Input | Numeric | |
| dm_stdev | Input | Numeric | |
| dm_skewness | Input | Numeric | |
| dm_kurtosis | Input | Numeric | |
| class | Target | Binary | 0, 1 |
3. Model
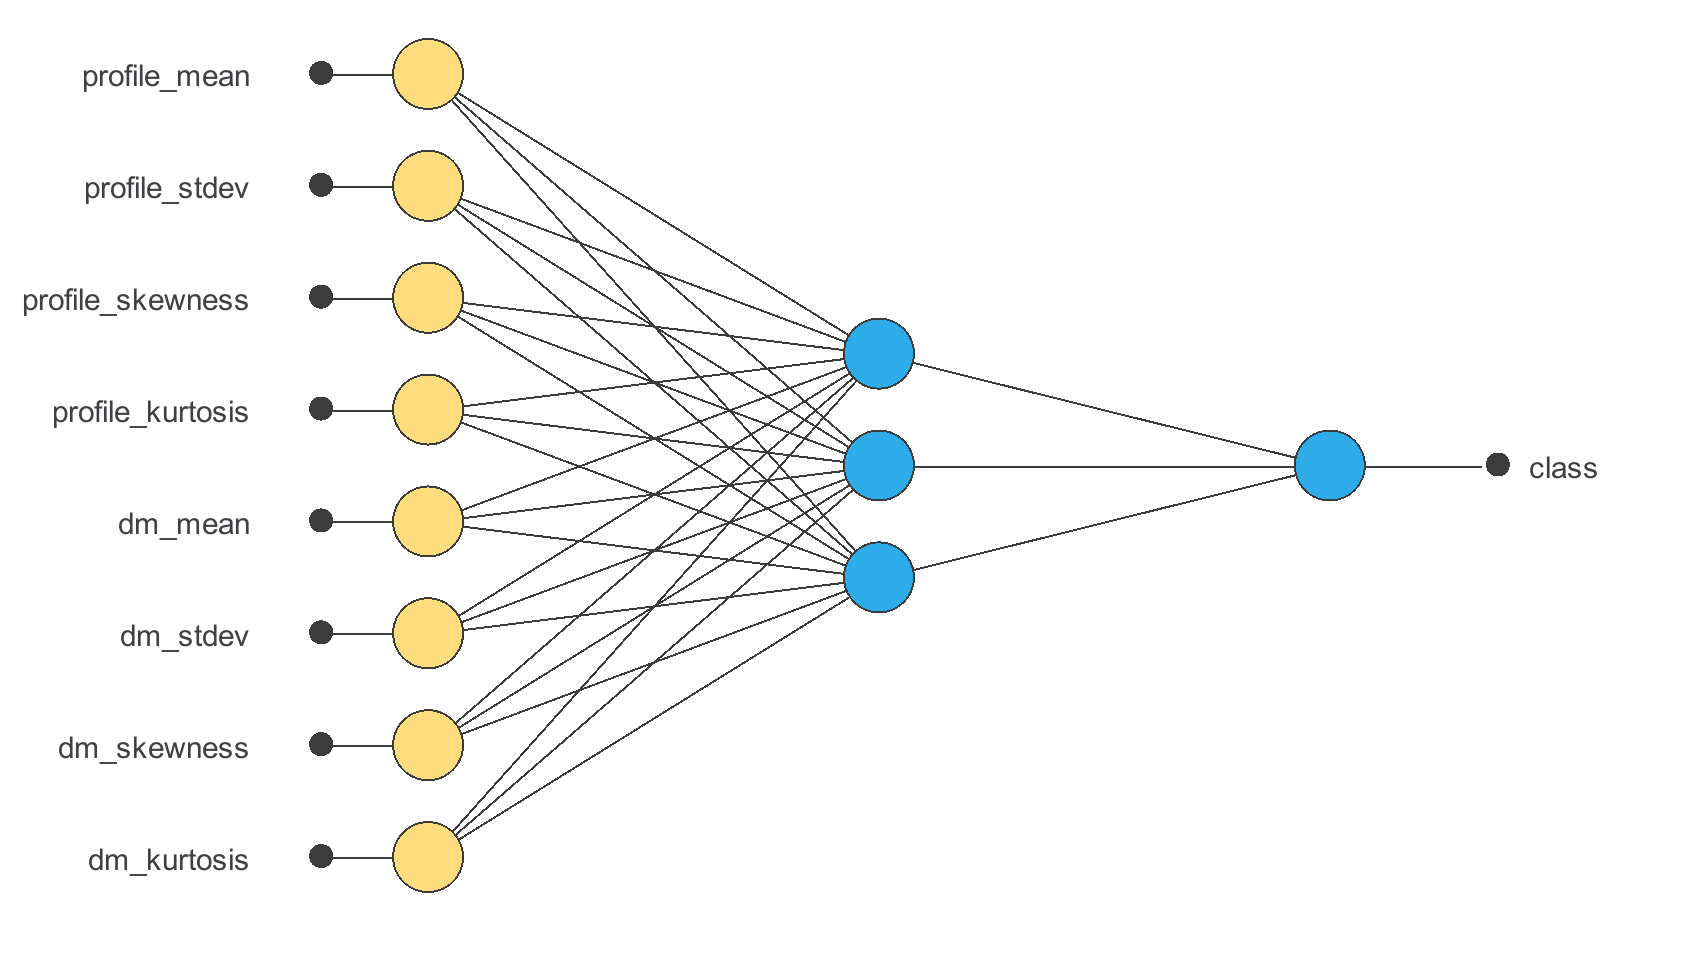
The model has 8 encoded inputs and 1 outputs. No architecture-selection experiment is recorded in this project. The diagram shows the topology used by the saved model.
| Layer | Input shape | Output shape | Activation |
|---|---|---|---|
| Scaling | 8 | 8 | |
| Dense | 8 | 3 | Tanh |
| Dense | 3 | 1 | Sigmoid |
Output values are uncalibrated model scores. For binary evaluation, the saved positive class is 1.
4. Training strategy
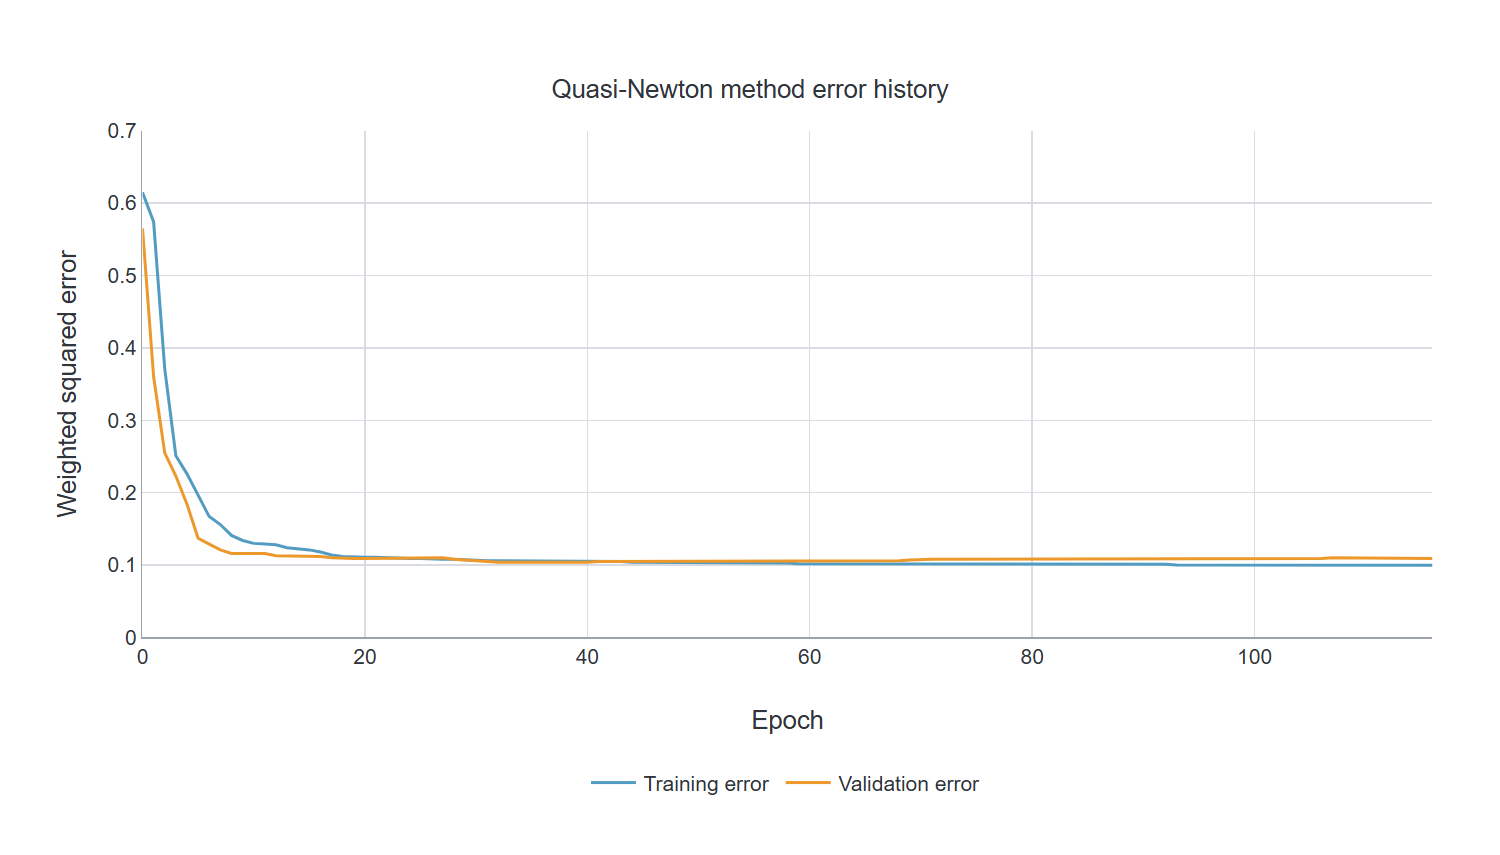
The saved training configuration uses QuasiNewton with WeightedSquaredError.
Quasi-Newton method results
| Measure | Value |
|---|---|
| Epochs number | 117 |
| Elapsed time | 00:00:00 |
| Stopping criterion | Minimum loss decrease |
| Training error | 0.106 |
| Validation error | 0.103 |
5. Model selection and baseline
No model selection experiment is recorded for this version. The validation subset guides fitting where a training report is present; it is distinct from the held-out test rows.
On this test subset a majority-class baseline would correctly classify 90.98% of the records. This baseline does not detect both classes and is not an optimized model.
6. Scientific validation
The figures and tables below refer to the current project’s saved testing analysis. The subset uses testing role 2; it contains 3579 source records.
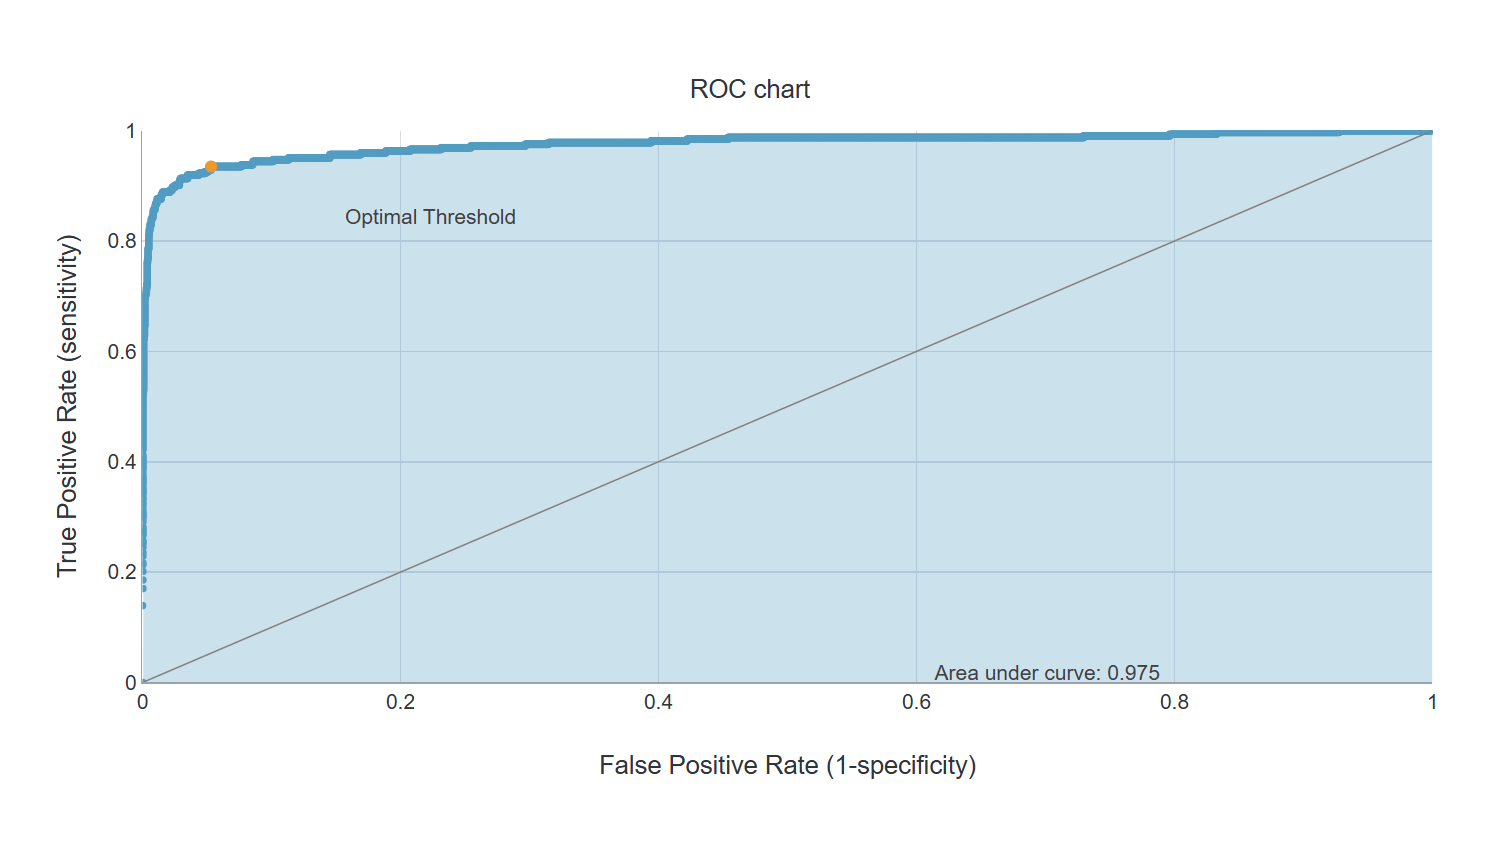
ROC AUC describes ranking on this testing subset. Any optimal threshold shown in the saved ROC report was selected descriptively on that same subset; it is not an independently validated operating policy.
These operating-point metrics are calculated from the saved confusion counts at threshold 0.5. The positive-label coding is stated in the model section.
Confusion table
| Measure | Predicted positive | Predicted negative | Total |
|---|---|---|---|
| Actual positive | 295 (8.2%) | 28 (0.8%) | 323 (9.0%) |
| Actual negative | 97 (2.7%) | 3159 (88.3%) | 3256 (91.0%) |
| Total | 392 (11.0%) | 3187 (89.0%) | 3579 (100.0%) |
| Test measure | Value |
|---|---|
| Testing records | 3579 |
| Positive cases | 323 |
| Positive prevalence | 9.02% |
| Accuracy | 96.51% |
| Sensitivity / recall | 91.33% |
| Specificity | 97.02% |
| Precision / PPV | 75.26% |
| F1 score | 0.825 |
Area under curve
| Measure | Value |
|---|---|
| Area under curve | 0.975 |
7. Inference and reproducibility
Open the downloaded project in Neural Designer, inspect the dataset roles and preprocessing, then review the saved task report. Use the same input schema and category order when calculating outputs. The ZIP contains the exact current .nd, its source data and the applicable dataset notices.
Workflow: source measurements → schema and availability checks → model output → domain review. Keep model versions, validation evidence and incoming-data monitoring together.
8. Validity, uncertainty and limitations
Class prevalence affects precision. Internal row-level testing does not establish performance on another telescope, observing campaign or detection pipeline. Review candidates with independent observational evidence and check calibration before interpreting scores as probabilities.
References
- HTRU2. Robert Lyon. 10.24432/C5DK6R
- Dataset terms: Creative Commons Attribution 4.0 International. Full attribution and transformations are included in
LICENSES/DATASET-LICENSE.txt. - Current Neural Designer project and saved task report, snapshot 6 October 2026.