
Turn product reviews into sentiment labels
Classify short English product reviews as bad or good with an attention-based text model. This example uses 1,000 labelled reviews and reproduces 67.5% accuracy on the 200 documents assigned to testing.
1. Business decision
Customer-experience teams need to organize review text before examining recurring product and service issues. A sentiment classifier can prioritize manual review and summarize feedback, provided that uncertain or ambiguous messages remain open to human interpretation.
Review triage
Group favourable and unfavourable feedback for a reviewer.
Error inspection
Inspect false positives and false negatives before defining a workflow.
Reproducible baseline
Start with the supplied small model and retain the same text preprocessing.
2. Data set
The local file is the Amazon subset of the UCI Sentiment Labelled Sentences collection, with the binary labels expressed as Bad and Good. These are review sentences, not synthetic examples. The collection is balanced by design; it does not estimate the natural proportion of satisfied customers.
Dataset source and access conditions. Source reviewed on 24 September 2026.
| Documents | Share (%) | |
|---|---|---|
| Bad | 500 | 50.00 |
| Good | 500 | 50.00 |
Target class distribution pie chart. Enable JavaScript to explore the chart.
| Subset | Samples |
|---|---|
| Training | 600 |
| Validation | 200 |
| Testing | 200 |
Inputs are UTF-8 text, one document per row, followed by its label in the tab-separated source. The saved word-level tokenizer provides padding, unknown, start and end tokens. Its vocabulary and sequence limit must travel with the trained model.
| Value | |
|---|---|
| Vocabulary size | 828 |
| Words | 824 |
| Reserved tokens | 4 |
| Words appearing once | 0 |
| Words never used | 0 |
| Tokens | |
|---|---|
| Median | 13 |
| 90th percentile | 26 |
| 99th percentile | 34 |
| Longest | 42 |
| Limit | 42 |
| Padding (%) | 65.73 |
| Samples | Tokens | Unknown | Unknown (%) | |
|---|---|---|---|---|
| Training | 600 | 8533 | 612 | 7.17 |
| Validation | 200 | 3040 | 246 | 8.09 |
| Testing | 200 | 2820 | 203 | 7.2 |
Vocabulary coverage curve. Enable JavaScript to explore the chart.
3. Model
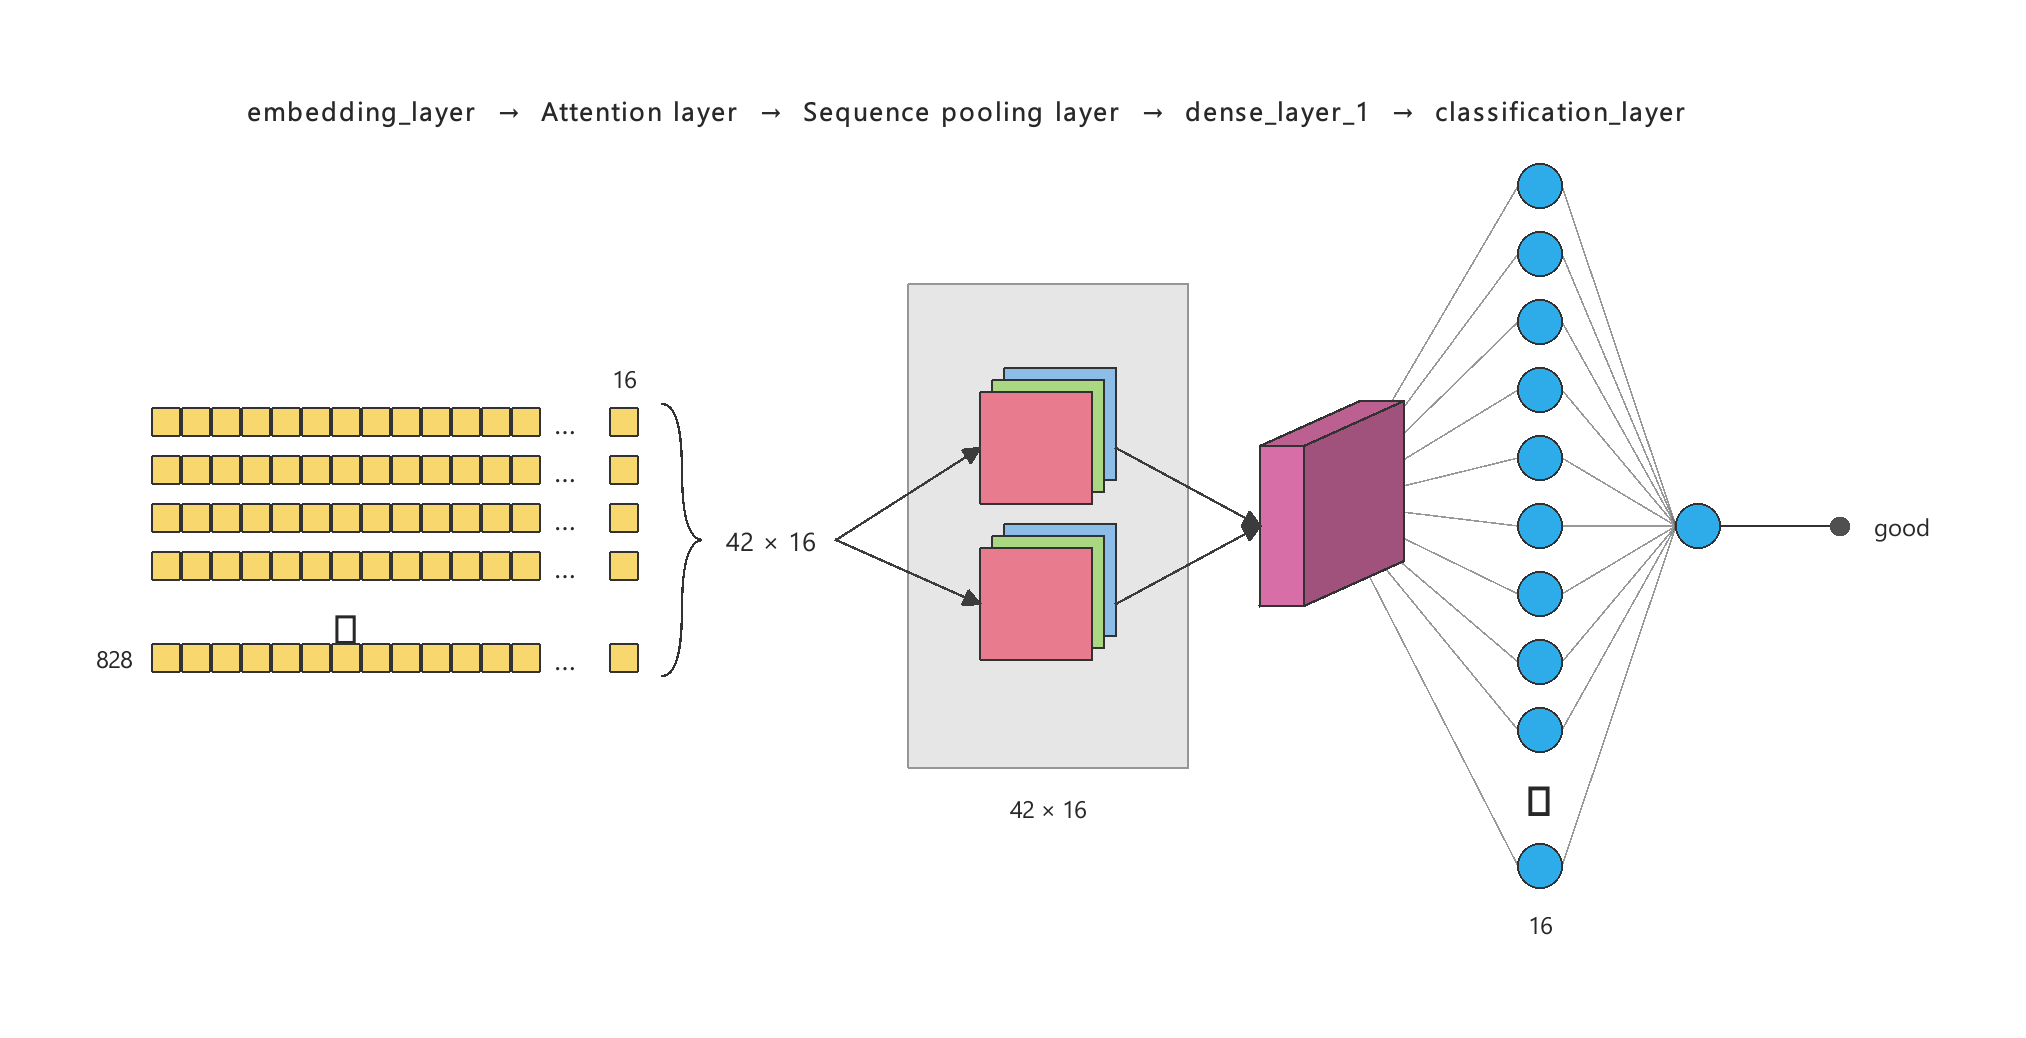
The following configuration comes from the saved trained model. The same topology is used before and after training; no separate architecture-selection run is recorded.
| Layer | Input shape | Output shape | Configuration |
|---|---|---|---|
| Embedding | 42 | 42 × 16 | Vocabulary 828; positional encoding |
| MultiHeadAttention | 42 × 16 | 42 × 16 | 2 attention heads; non-causal |
| Pooling3d | 42 × 16 | 16 | AveragePooling |
| Dense | 16 | 16 | ReLU |
| Dense | 16 | 1 | Sigmoid |
Sigmoid or softmax outputs are uncalibrated model scores. For this binary model, the positive label is good. The 0.5 threshold assigns the positive class.
4. Training strategy
Training minimizes cross-entropy using Adam. The saved configuration uses a learning rate of 0.001, mini-batches of 64 and L2 regularization with weight 0.001.
| Value | |
|---|---|
| Epochs number | 40 |
| Elapsed time | 00:00:02 |
| Stopping criterion | Maximum epochs number |
| Training error | 0.409 |
| Validation error | 0.462 |
Adaptive moment estimation error history. Enable JavaScript to explore the chart.
The summary table and epoch history are retained as separate native report outputs. Epoch-history endpoints need not equal the restored best-validation model; they are not additional test metrics.
5. Model selection
No architecture selection or feature selection experiment is recorded in this report. The model-selection settings in the project are configuration options, not evidence that a search was run. The validation subset monitors training; the testing subset is intended for subsequent evaluation.
A constant classifier choosing the most frequent training label (bad) achieves 49.00% accuracy on these same testing rows, compared with 67.50% for the supplied model. The baseline label is chosen only from the training rows; this is a simple comparator, not a separately tuned model.
6. Testing analysis
The exported model was rerun on the 200 documents whose saved sample role is testing. Predicted labels reproduce the saved confusion counts. Rows are actual classes and columns are predicted classes.
| Metric | Value |
|---|---|
| Testing documents | 200 |
| Accuracy | 67.50% |
| Macro F1 | 0.675 |
| Actual / predicted | bad | good |
|---|---|---|
| bad | 68 | 30 |
| good | 35 | 67 |
| Class | Support | Precision | Recall | F1 |
|---|---|---|---|---|
| bad | 98 | 0.660 | 0.694 | 0.677 |
| good | 102 | 0.691 | 0.657 | 0.673 |
At threshold 0.5, good is positive: TP = 67, FN = 35, FP = 30 and TN = 68. Sensitivity is 65.69%, specificity 69.39%, precision 69.07% and NPV 66.02%. Positive-label prevalence is 102/200 = 51%; predictive values refer to this benchmark composition.
| Value | |
|---|---|
| Area under curve | 0.785 |
The saved ROC AUC is 0.785. Its test-derived threshold of 0.633 is exploratory and is not used for the 0.5-threshold confusion matrix.
ROC chart. Enable JavaScript to explore the chart.
7. Model deployment
Understanding customer feedback
See how the model distinguishes favourable and unfavourable customer reviews. Each example shows the original review and the score assigned to each sentiment.
Example 1
Input text
The only thing that I think could improve is the sound leaks out from the headset.
Predicted class: bad
Model score: 70.61%
| Class | Output score |
|---|---|
| bad | 0.706127 |
| good | 0.293873 |
Example 2
Input text
Excellent sound, battery life and inconspicuous to boot!.
Predicted class: good
Model score: 62.78%
| Class | Output score |
|---|---|
| bad | 0.372200 |
| good | 0.627800 |
These are illustrative predictions, separate from the testing metrics above. Output scores have not been calibrated.
Download the original Neural Designer project and native figures, then relink the source dataset. The ZIP is a project archive; it does not contain the standalone Neural Engine runtime.
For batch inference, export a deployment package from Neural Designer. Keep the generated Python wrapper beside its engine/ and model/ folders. The supplied export uses Windows x64 and Python 3, with CPU inference by default.
python amazon_reviews.py "A short text to classify"Preserve the trained vocabulary and sequence limit for text, or the saved image dimensions, channel handling and scaling for images. Record the model version and input quality before sending outputs for human review. The wrapper’s score output is not evidence of probability calibration.
8. Evidence and limitations
Short reviews, unfamiliar vocabulary, negation, sarcasm and mixed sentiment can cause errors. The balanced benchmark does not represent live customer sentiment prevalence. Evaluate on a later, product-specific sample before routing reviews automatically.
The supplied artifacts do not establish independence by person, product, author, acquisition session or site. Check duplicates and group-related records before reporting performance on a new population. Calibration and external validation are not established; monitor drift and review errors before operational decisions.
Vocabulary statistics cover the saved dataset. A training-only vocabulary fit is not documented, so these results do not establish a fully isolated preprocessing evaluation. Refit preprocessing inside the training partition when comparing models on a strict benchmark.