
Inspect reconstruction errors in bearing vibration
An autoencoder models vibration-window features from the complete E2 run-to-failure experiment. The adapted dataset contains 9,925 one-second windows; the final tenth of acquisitions is labelled anomalous for this teaching example.
1. Industrial challenge
Reliability analysts can inspect how reconstruction error changes across one bearing run and evaluate a recorded operating threshold. The anomaly labels are derived by Artelnics from acquisition order, not supplied failure diagnoses.
Derived labels
Identify the final acquisition decile explicitly.
Reconstruction evidence
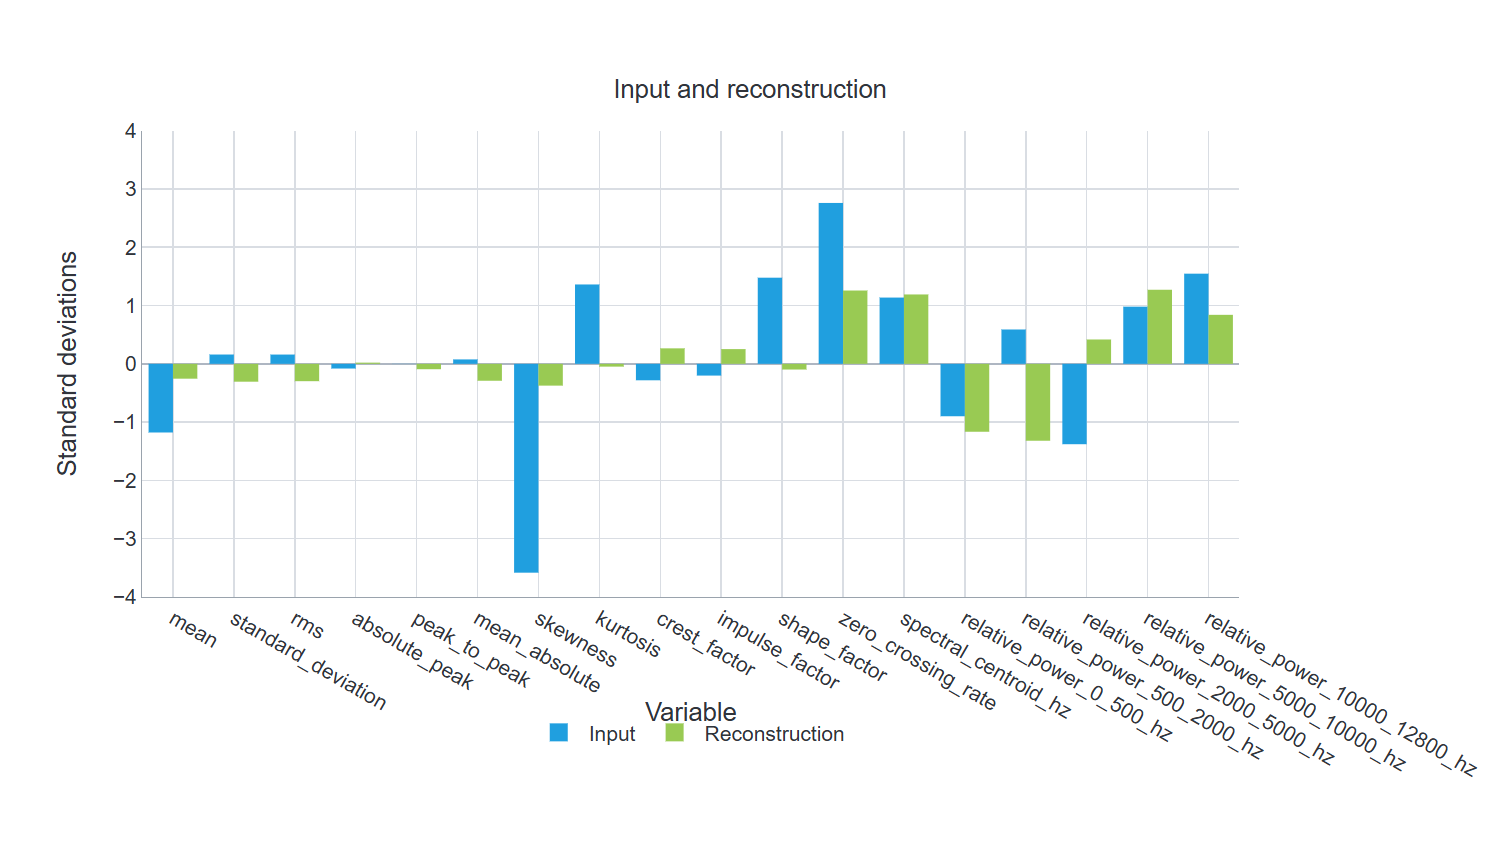
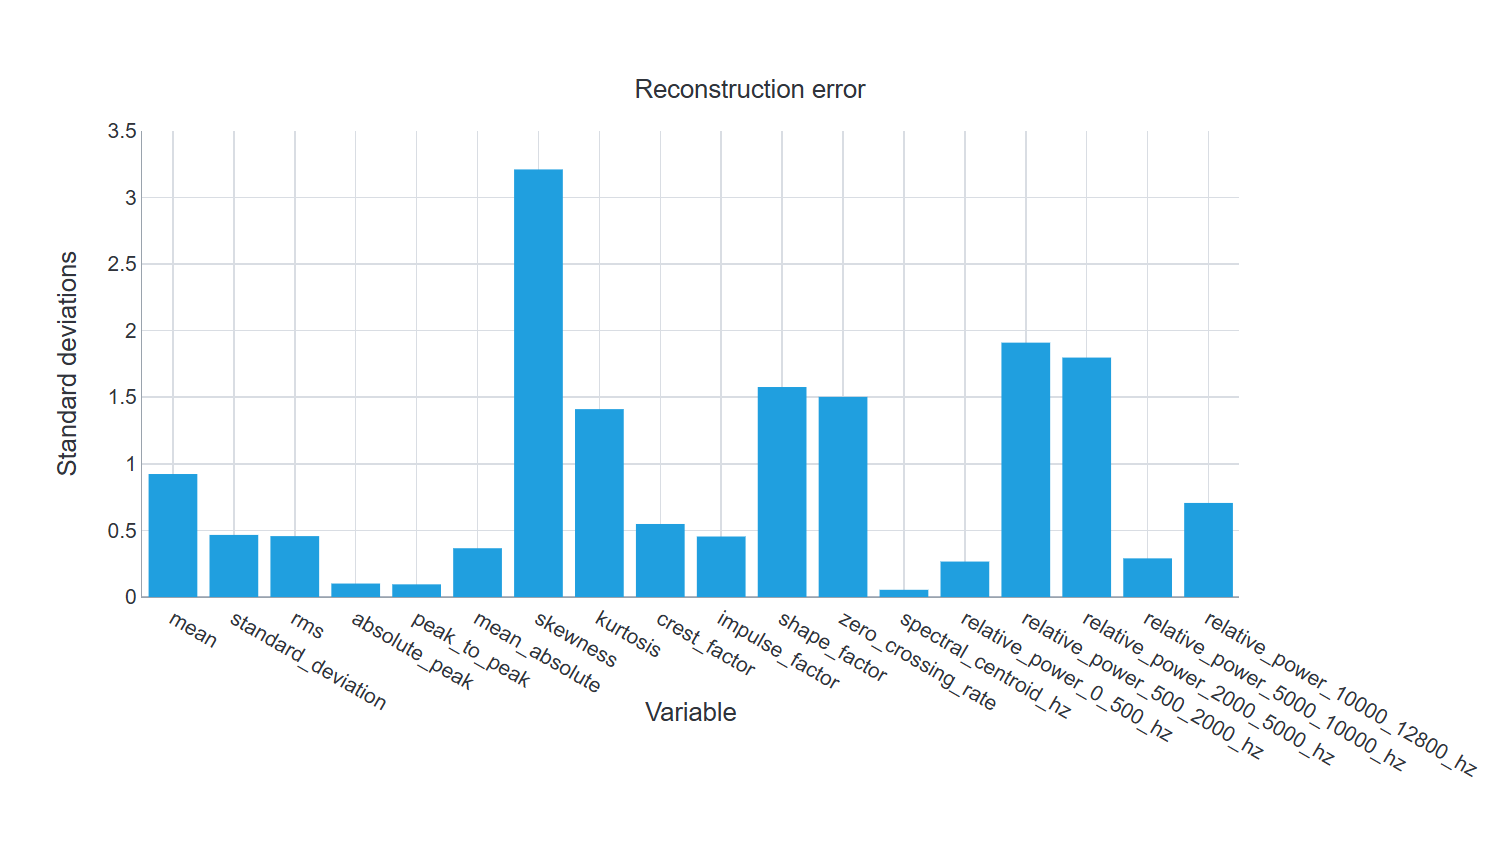
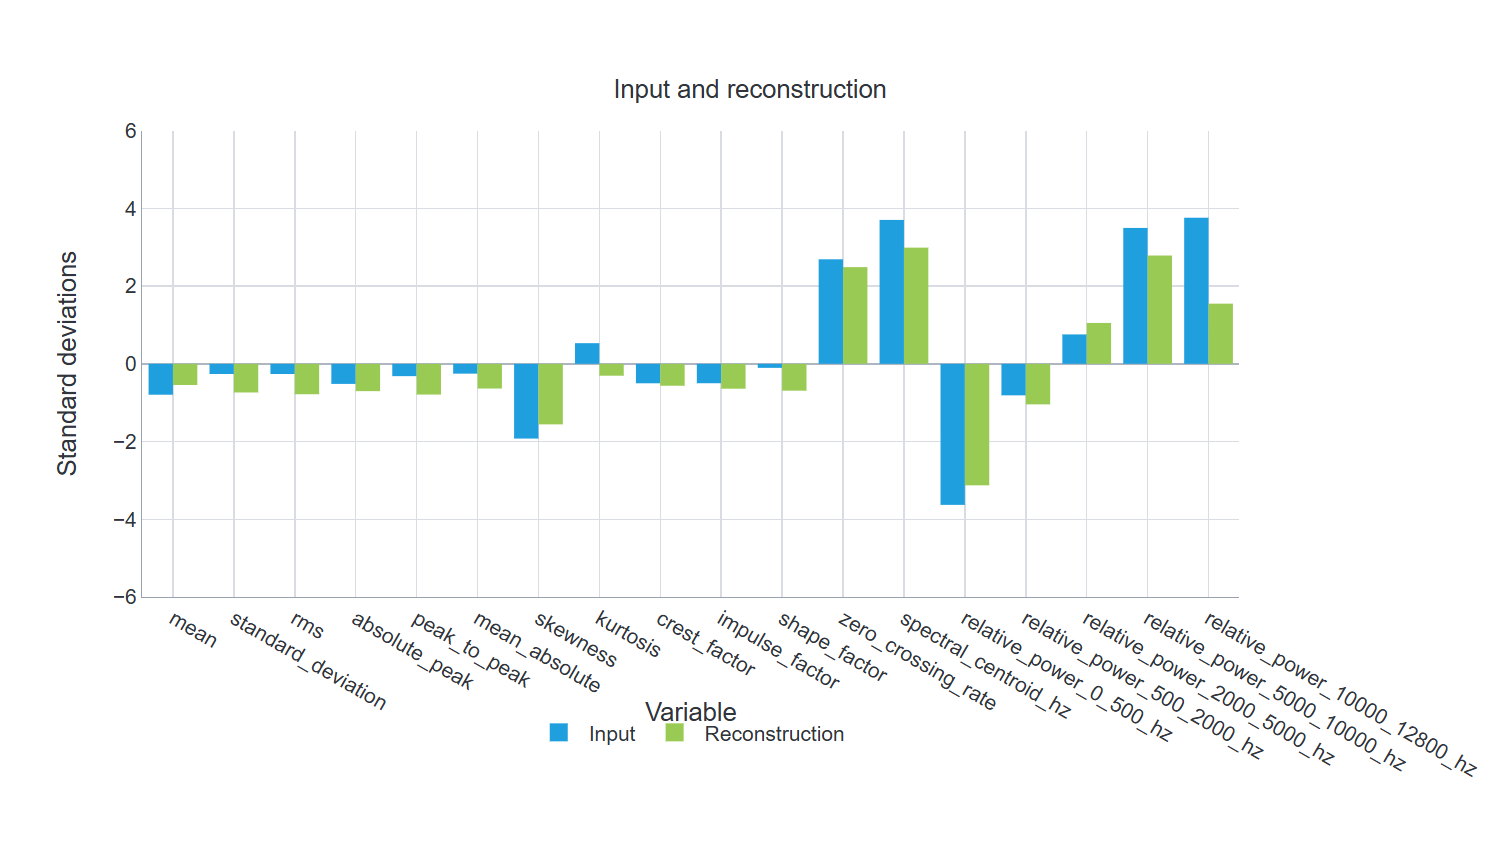
Compare saved samples with their reconstructions.
False-alarm review
Inspect both missed labels and false-positive counts.
2. Data set
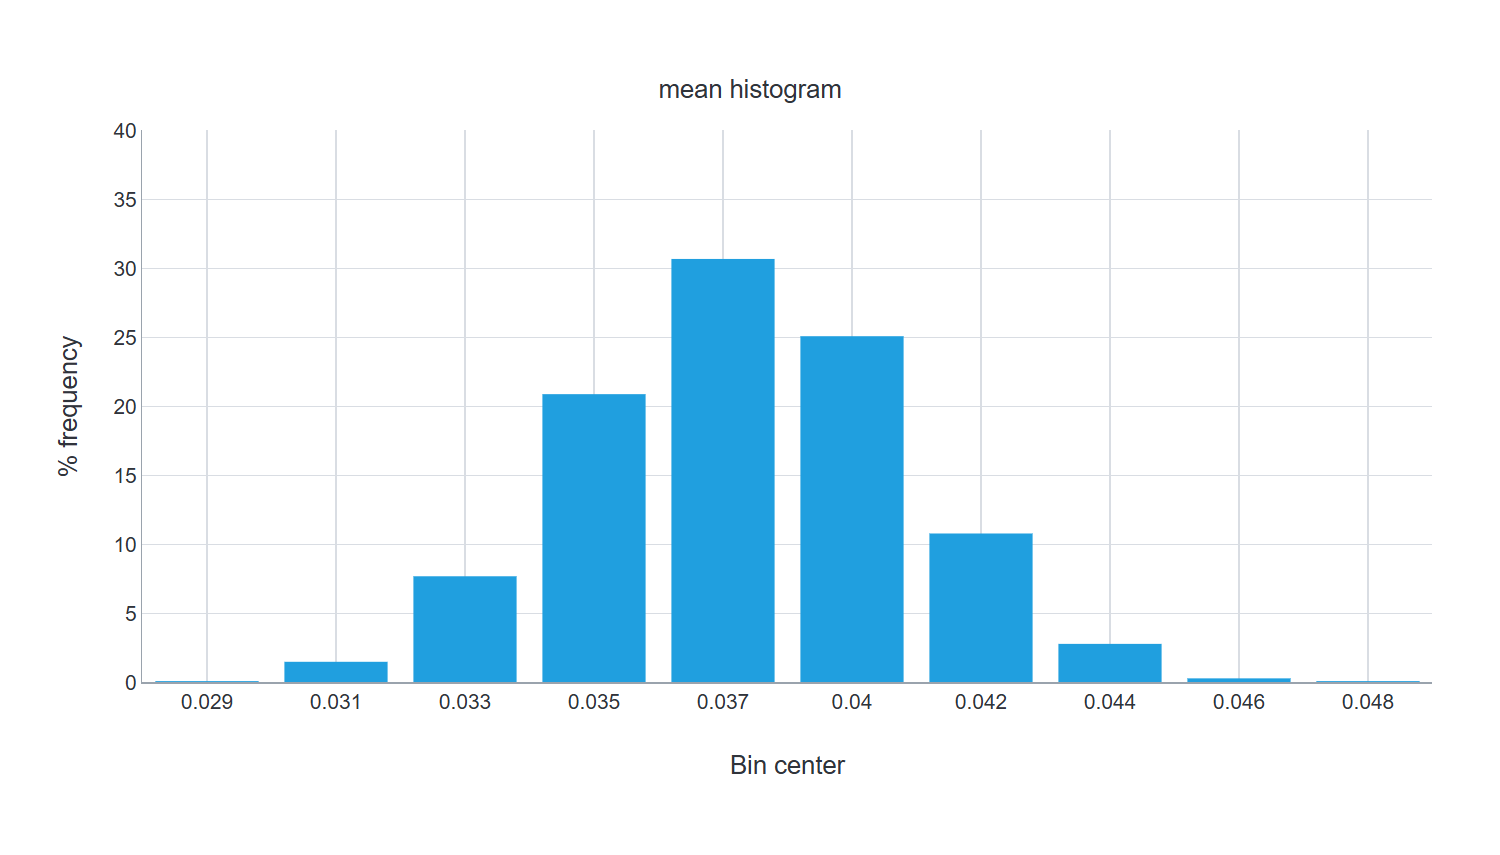
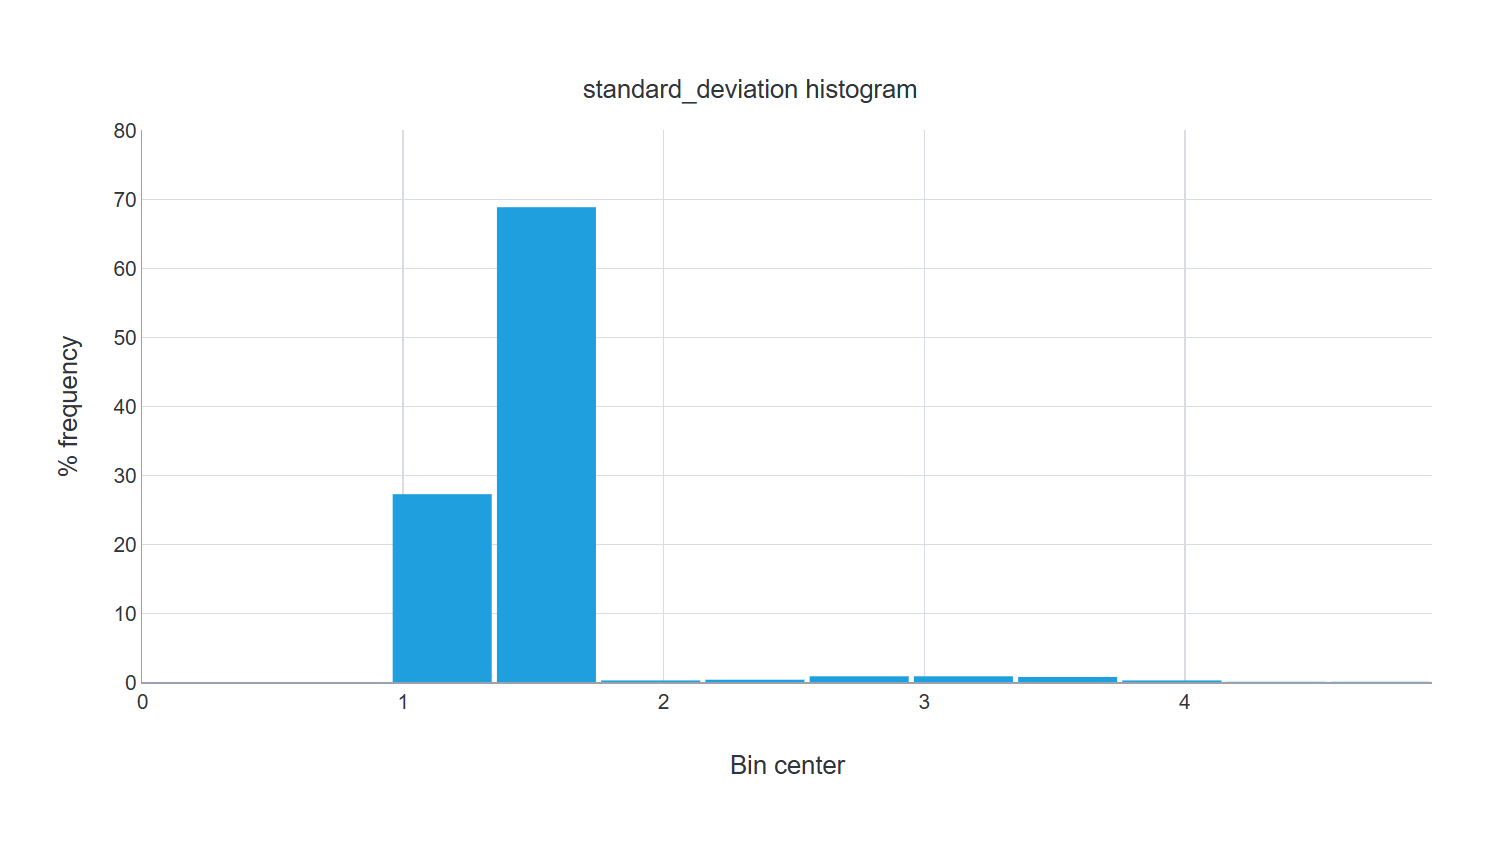
The source is Run-to-failure vibration dataset of self-aligning double-row ball bearings – Part 1. Each five-second acquisition at 25.6 kHz is split into five non-overlapping windows. Eighteen time-domain and relative spectral-power features are retained alongside the derived anomaly label.
Source: Run-to-failure vibration dataset of self-aligning double-row ball bearings – Part 1. Dataset license: CC-BY-4.0. The downloadable ZIP includes the adapted data and attribution notices.
| Dataset measure | Saved value |
|---|---|
| Analysis unit | one-second vibration window |
| Records | 9,925 |
| Raw variables | 19 |
| Encoded model inputs | 18 |
| Model outputs | 18 |
| Training roles | 5358 |
| Validation / selection roles | 1786 |
| Testing roles | 2781 |
| Unused roles | 0 |
| Field | Role | Type | Categories |
|---|---|---|---|
| mean | InputTarget | Numeric | |
| standard_deviation | InputTarget | Numeric | |
| rms | InputTarget | Numeric | |
| absolute_peak | InputTarget | Numeric | |
| peak_to_peak | InputTarget | Numeric | |
| mean_absolute | InputTarget | Numeric | |
| skewness | InputTarget | Numeric | |
| kurtosis | InputTarget | Numeric | |
| crest_factor | InputTarget | Numeric | |
| impulse_factor | InputTarget | Numeric | |
| shape_factor | InputTarget | Numeric | |
| zero_crossing_rate | InputTarget | Numeric | |
| spectral_centroid_hz | InputTarget | Numeric | |
| relative_power_0_500_hz | InputTarget | Numeric | |
| relative_power_500_2000_hz | InputTarget | Numeric | |
| relative_power_2000_5000_hz | InputTarget | Numeric | |
| relative_power_5000_10000_hz | InputTarget | Numeric | |
| relative_power_10000_12800_hz | InputTarget | Numeric | |
| anomaly | Evaluation | Binary | 0, 1 |
3. Model
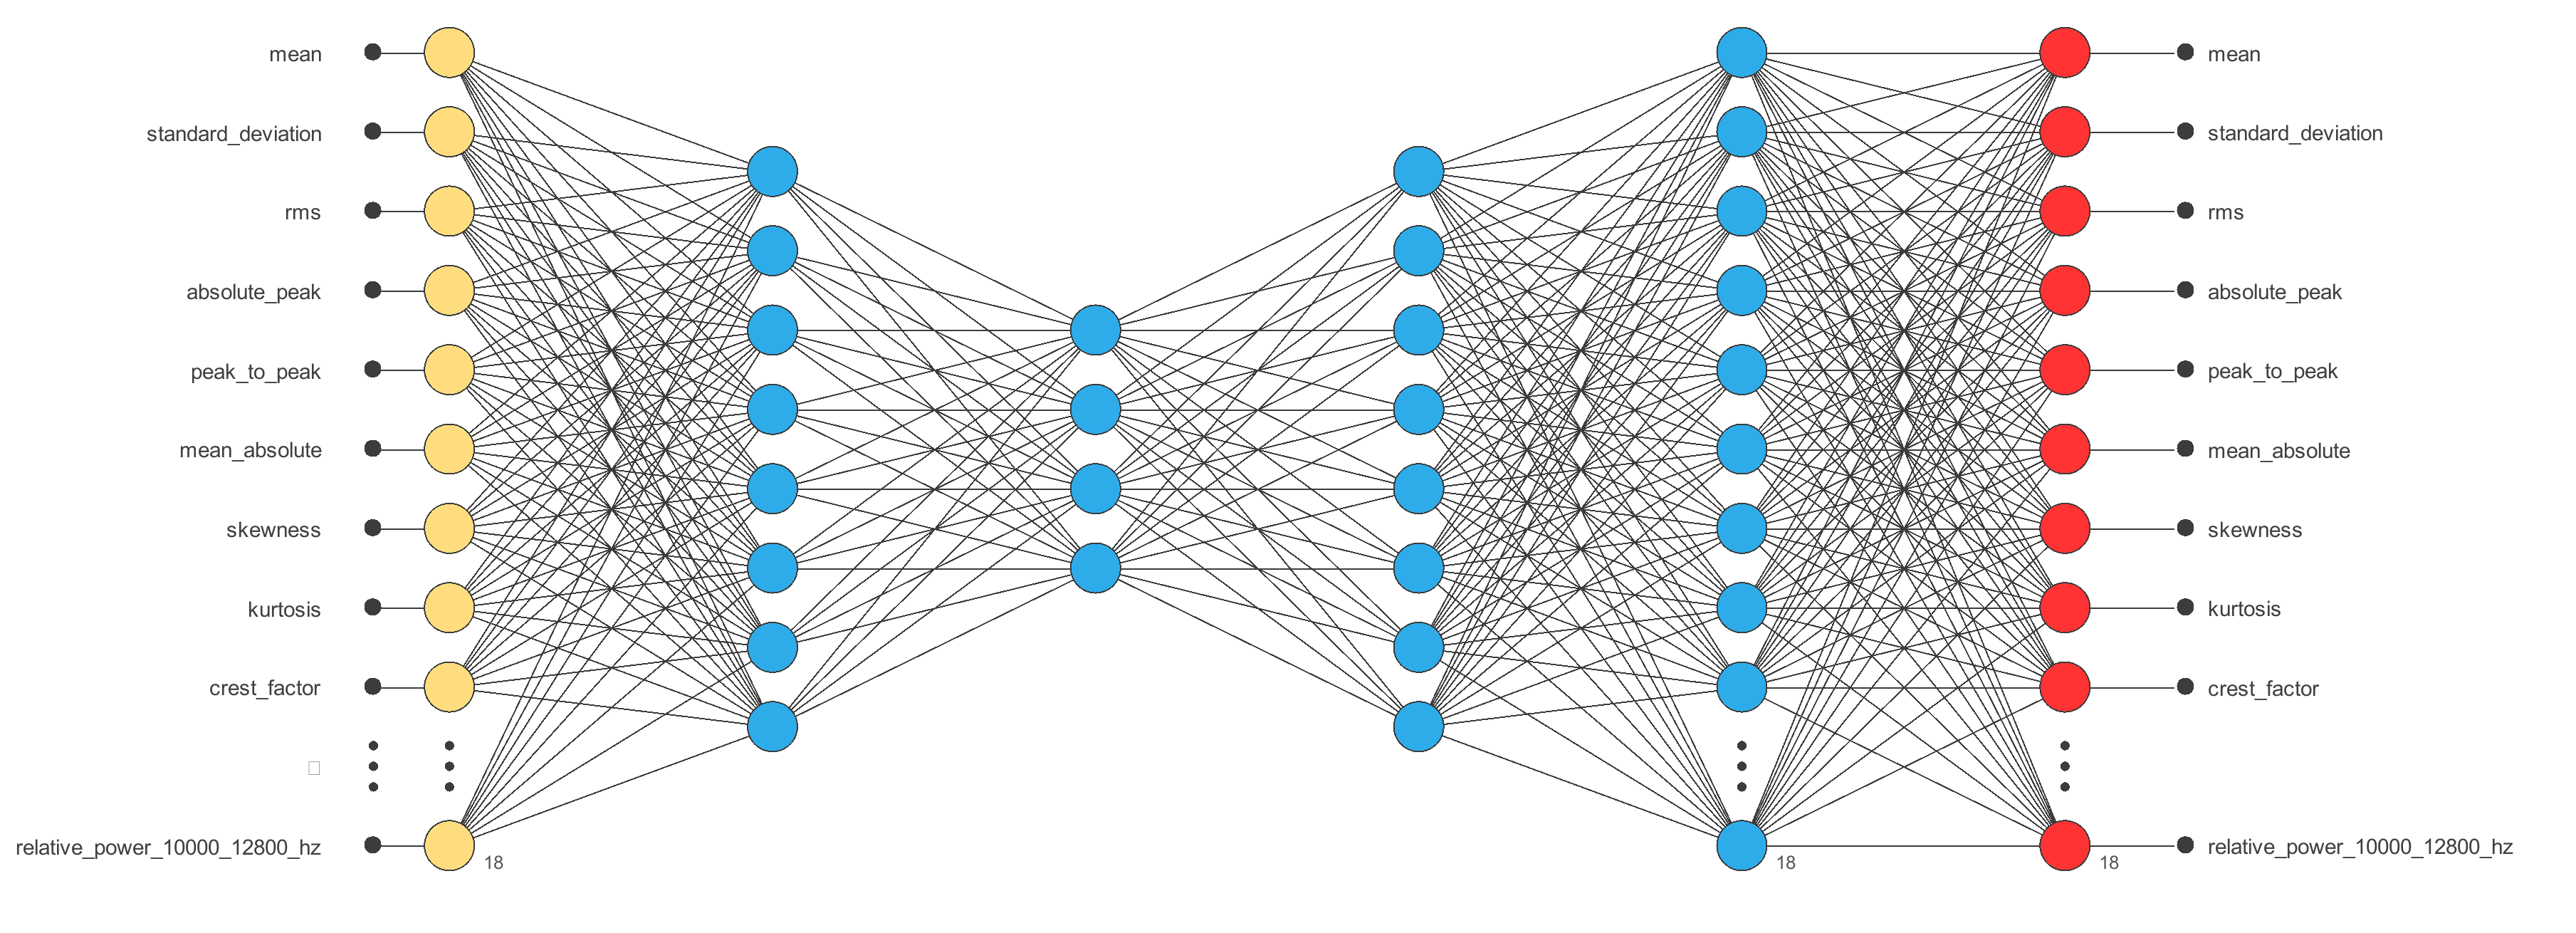
The model has 18 encoded inputs and 18 outputs. No architecture-selection experiment is recorded in this project. The diagram shows the topology used by the saved model.
| Layer | Input shape | Output shape | Activation |
|---|---|---|---|
| Scaling | 18 | 18 | |
| Dense | 18 | 8 | ReLU |
| Dense | 8 | 4 | ReLU |
| Dense | 4 | 8 | ReLU |
| Dense | 8 | 18 | Identity |
| Unscaling | 18 | 18 |
4. Training strategy
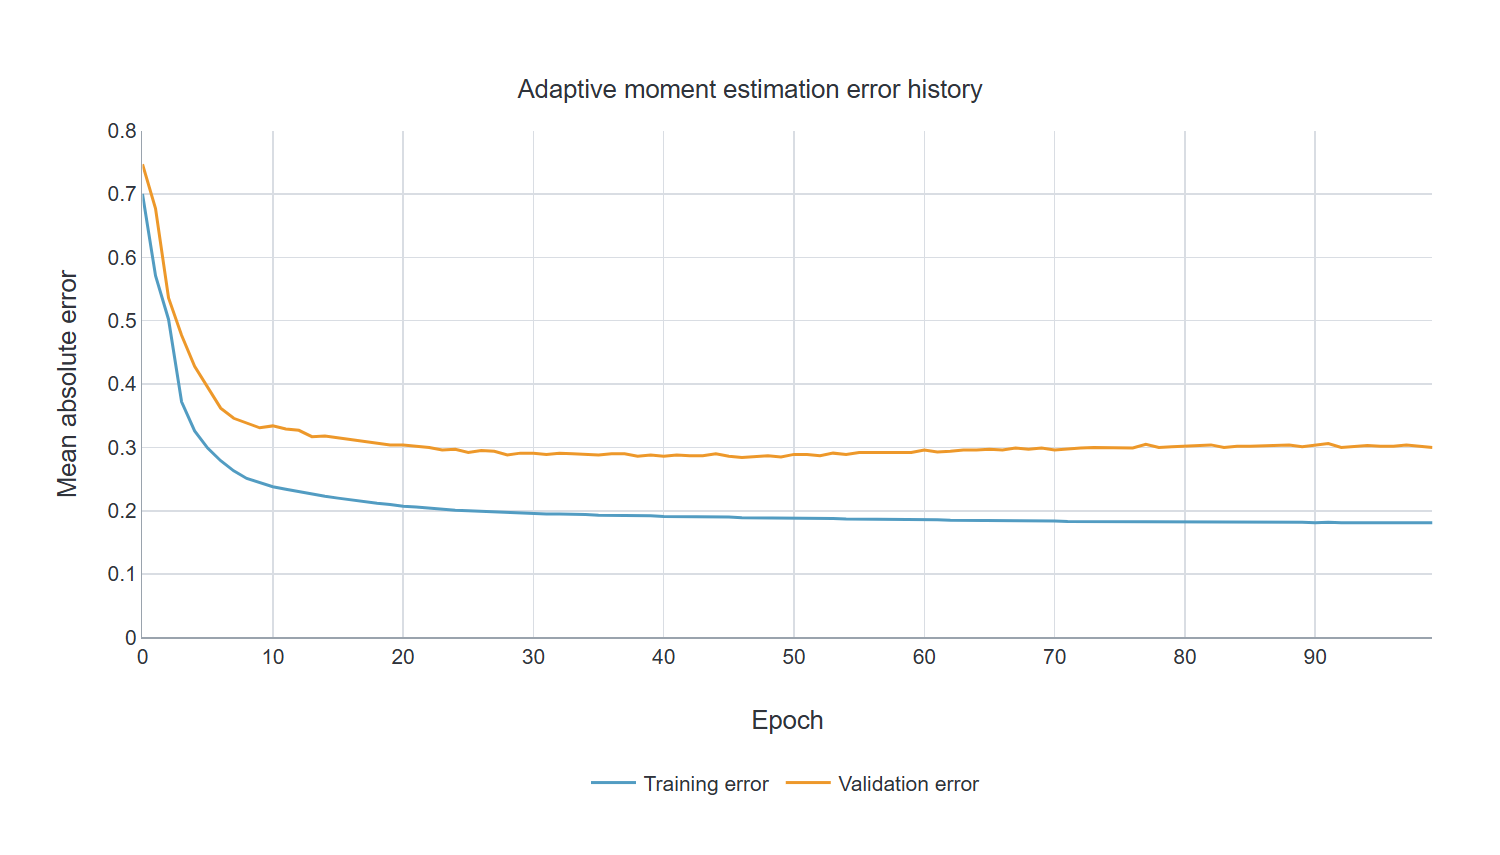
The saved training configuration uses Adam with MeanAbsoluteError.
Adaptive moment estimation results
| Measure | Value |
|---|---|
| Epochs number | 100 |
| Elapsed time | 00:00:07 |
| Stopping criterion | Maximum epochs number |
| Training error | 0.189 |
| Validation error | 0.284 |
5. Model selection
No model selection experiment is recorded for this version. The validation subset guides fitting where a training report is present; it is distinct from the held-out test rows.
6. Testing analysis
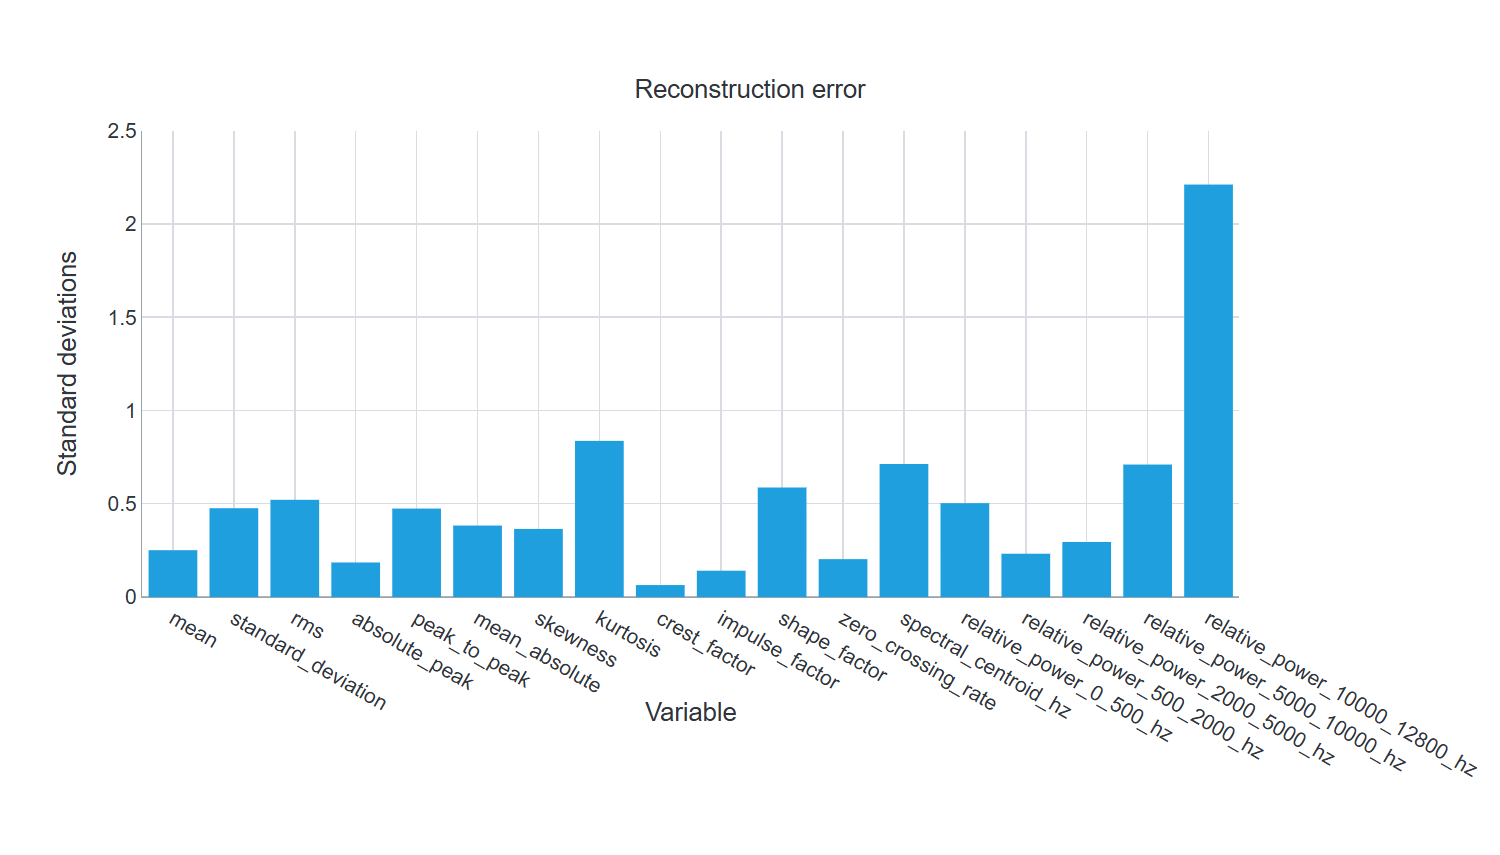
The figures and tables below refer to the current project’s saved testing analysis. The subset uses testing role 2; it contains 2781 source records.
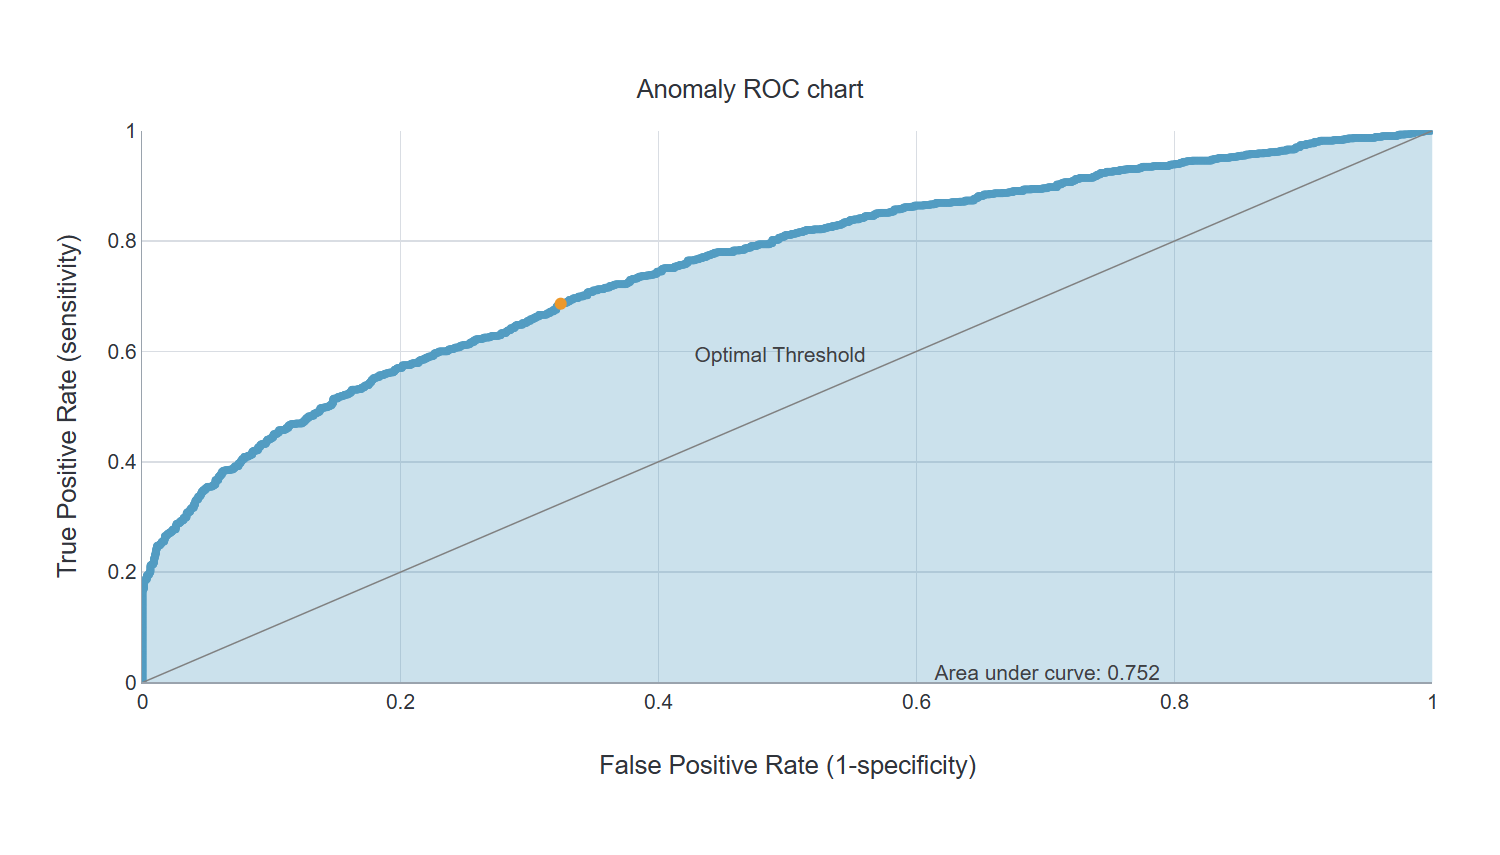
ROC AUC describes ranking on this testing subset. Any optimal threshold shown in the saved ROC report was selected descriptively on that same subset; it is not an independently validated operating policy.
Area under curve
| Measure | Value |
|---|---|
| Area under curve | 0.752 |
Anomaly detection tests
| Test | Value |
|---|---|
| Accuracy | 0.492988 |
| Recall | 0.925628 |
| Specificity | 0.25196 |
| Precision | 0.408064 |
| F1 score | 0.566421 |
Confusion matrix
| Measure | Predicted anomalous | Predicted normal |
|---|---|---|
| Real anomalous | 921 | 74 |
| Real normal | 1336 | 450 |
7. Model deployment
Open the downloaded project in Neural Designer, inspect the dataset roles and preprocessing, then review the saved task report. Use the same input schema and category order when calculating outputs. The ZIP contains the exact current .nd, its source data and the applicable dataset notices.
Workflow: source measurements → schema and availability checks → model output → domain review. Keep model versions, validation evidence and incoming-data monitoring together.
8. Scope and limitations
Windows within one acquisition and one bearing run are correlated. Test results do not establish performance on another bearing or machine. The saved detector produces many false positives at its operating threshold; evaluate threshold selection, acquisition grouping and independent runs before operational use.
References
- Run-to-failure vibration dataset of self-aligning double-row ball bearings – Part 1. Alberto Gabrielli; Luca Arpa; Mattia Battarra; Emiliano Mucchi. 10.17632/htk59pp5wx.1
- Dataset terms: Creative Commons Attribution 4.0 International. Full attribution and transformations are included in
LICENSES/DATASET-LICENSE.txt. - Current Neural Designer project and saved task report, snapshot 6 October 2026.