
Classify dermoscopic images as benign or melanoma
A compact convolutional network built and trained in Neural Designer 8.0.1 scores all 900 images of the ISIC 2016 lesion-classification training release. On 180 held-out testing images it reaches ROC AUC 0.739. At a threshold fixed on the validation images, it flags 26 of 37 melanomas and leaves 98 of 143 benign lesions unflagged. It is an educational research example, not a diagnostic tool.
1. Clinical question and intended use
Dermoscopy magnifies the pigment structures of a skin lesion, and melanoma is the skin cancer that dermoscopic triage most needs to catch. This example asks a narrow research question: how well can a small convolutional network, trained from scratch on 540 labeled dermoscopic images, rank new images toward the melanoma label?
The example shows the complete Neural Designer workflow for image classification: importing an image folder, training a network, choosing an operating threshold on validation data and reporting every error on testing data. It does not establish clinical performance.
Licensed, traceable images
Every image comes from the CC0 ISIC 2016 release, with source and file hashes in the manifest.
Threshold fixed in advance
The operating point is chosen on validation images before the testing images are evaluated.
Complete error accounting
Report missed melanomas and false alarms, not only accuracy.
2. Images, labels and endpoint
The data are the 900 dermoscopic images of the ISIC 2016 Challenge, Part 3 training release, published by the International Skin Imaging Collaboration under CC0 1.0. Each image has one label: 727 are benign and 173 are malignant (melanoma), a melanoma share of 19.2%. The endpoint is that label; the positive class is malignant.
The original JPEG images range from 576 × 542 to 4288 × 2848 pixels (median 1024 × 768). Each one is converted to RGB and resized to 300 × 300 pixels with Lanczos resampling, without cropping, so non-square lesions are slightly distorted. This is the same preparation as the 102-image OpenNN example, whose images are bit-identical to the corresponding files here.
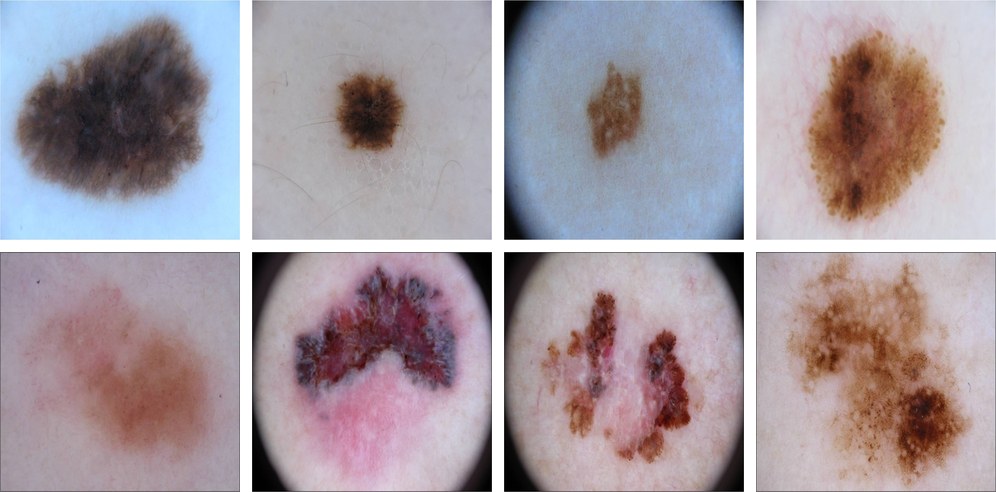
Neural Designer imports the folder with one subfolder per class and assigns images at random to training (60%), validation (20%) and testing (20%) subsets. The project stores this assignment.
| Subset | Images | Benign | Malignant | Melanoma share | Purpose |
|---|---|---|---|---|---|
| Training | 540 | 438 | 102 | 18.9% | Fit the network parameters |
| Validation | 180 | 146 | 34 | 18.9% | Compare candidates and fix the threshold |
| Testing | 180 | 143 | 37 | 20.6% | Final evaluation, used once |
| Total | 900 | 727 | 173 | 19.2% | ISIC 2016 Part 3 training release |
3. Model
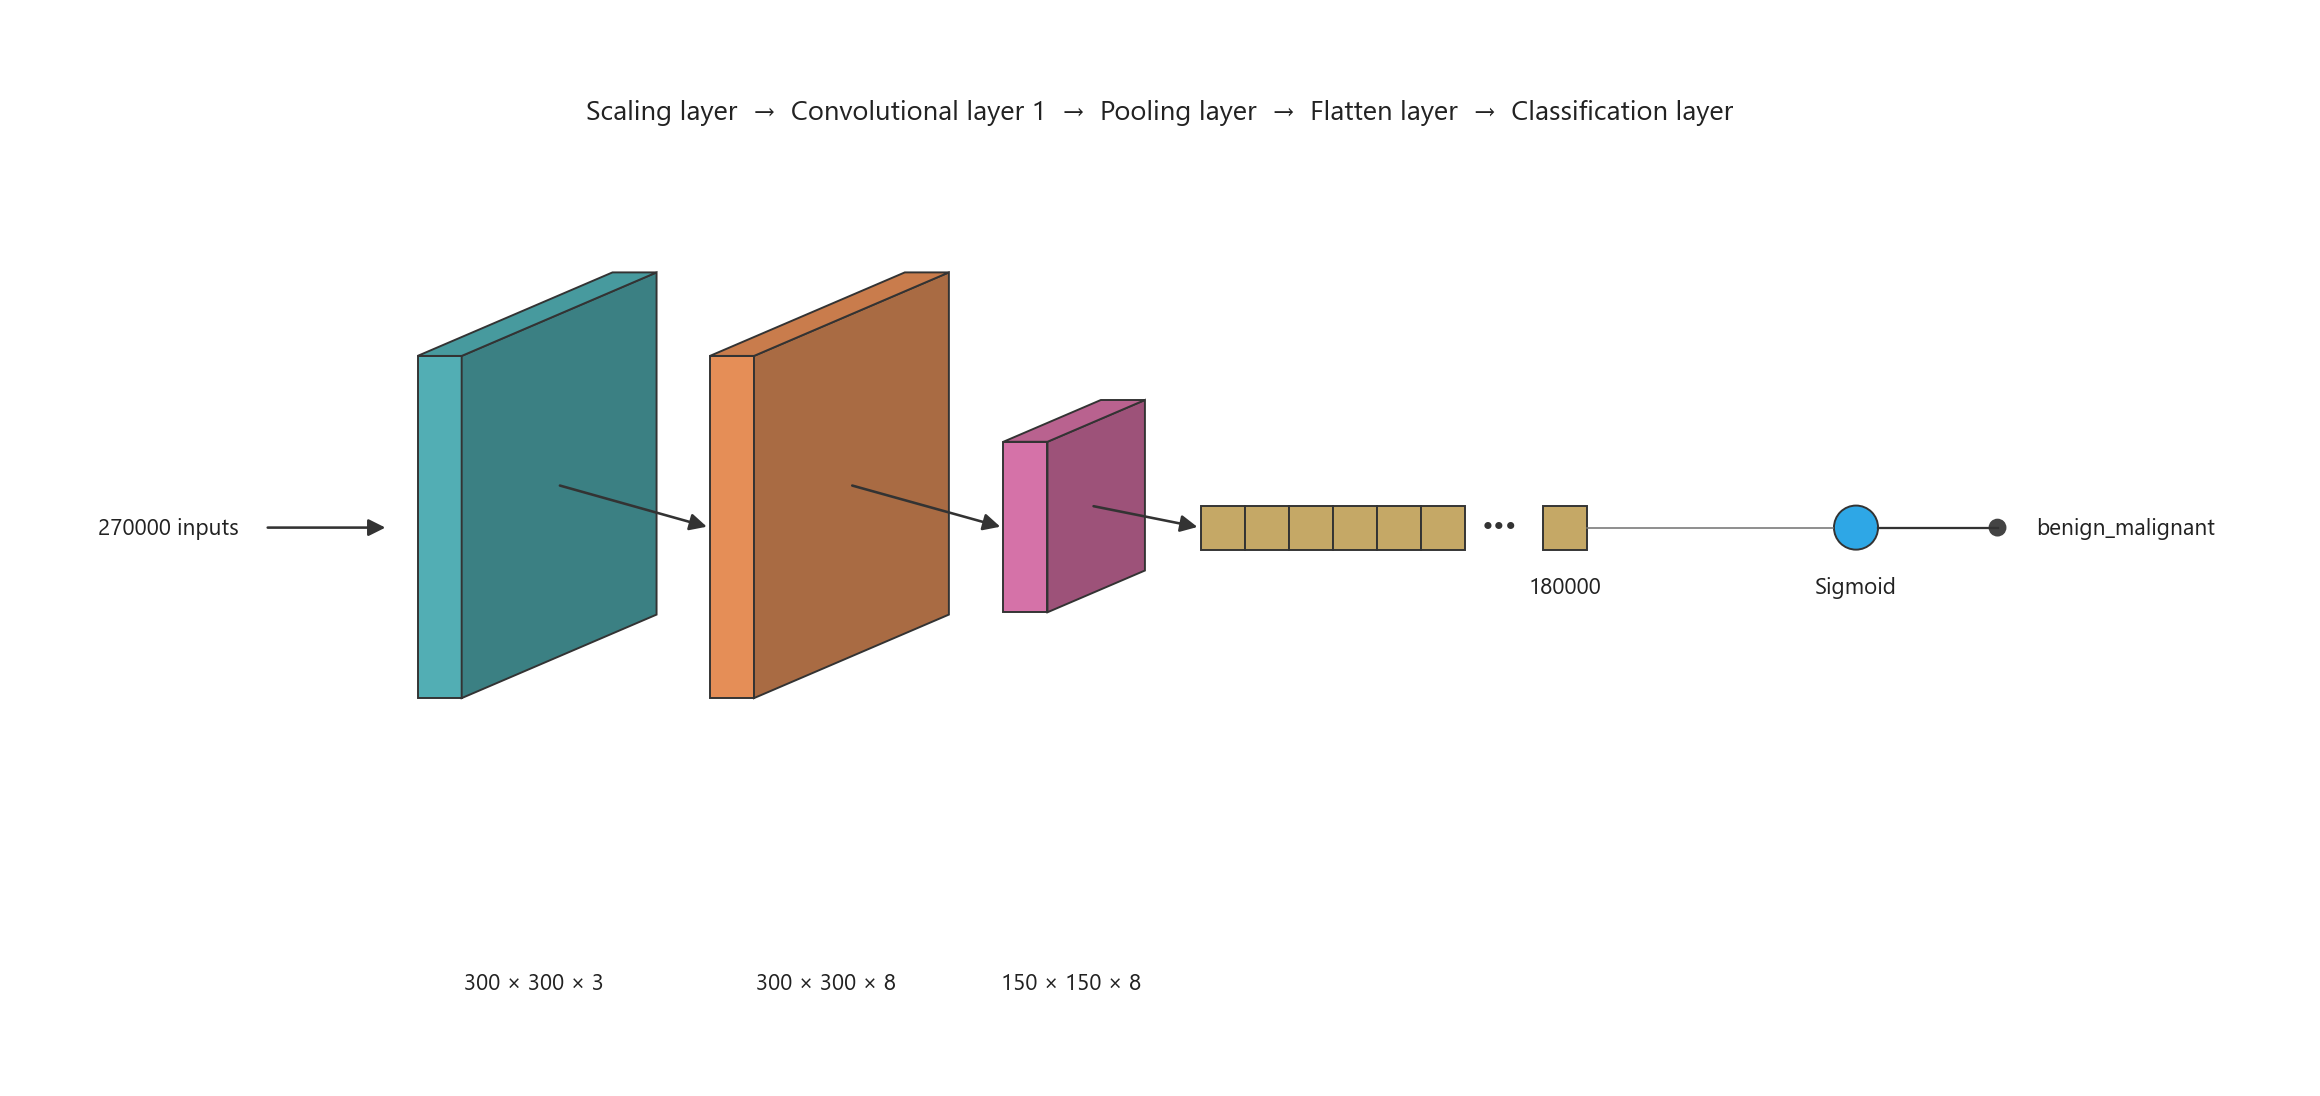
The network is the default image-classification architecture that Neural Designer 8.0.1 creates for 300 × 300 RGB images: one convolutional layer with eight 3 × 3 filters, max pooling and a single sigmoid output. It has 180,225 trainable parameters.
| Layer | Input shape | Output shape | Configuration | Parameters |
|---|---|---|---|---|
| Scaling | 300 × 300 × 3 | 300 × 300 × 3 | ImageMinMax pixel scaling | 0 |
| Convolutional | 300 × 300 × 3 | 300 × 300 × 8 | 8 filters, 3 × 3, stride 1, same padding, ReLU | 224 |
| Pooling | 300 × 300 × 8 | 150 × 150 × 8 | Max pooling, 2 × 2, stride 2 | 0 |
| Flatten | 150 × 150 × 8 | 180,000 | 0 | |
| Dense (classification) | 180,000 | 1 | Sigmoid | 180,001 |
Output contract. The output is a score between 0 and 1 for the malignant class; the benign score is its complement. The scores are not calibrated probabilities. The image is flagged as suspicious when the malignant score reaches the decision threshold described in Section 5.
4. Training strategy
Training minimizes the cross-entropy error with the adaptive moment estimation (Adam) optimizer: learning rate 0.0001, mini-batches of 32 images, L2 regularization with weight 0.01 and 100 epochs. Training ran on an NVIDIA GeForce RTX 5070 Ti GPU.
The training and validation errors below are the mean binary cross-entropy of the malignant score over the images, without the regularization term. For reference, a constant score of 0.5 gives 0.693.
| Adaptive moment estimation results | Value |
|---|---|
| Epochs number | 100 |
| Elapsed time | 00:00:29 |
| Stopping criterion | Maximum epochs number |
| Training error | 0.261 |
| Validation error | 0.451 |
Training and validation cross-entropy error by epoch. Enable JavaScript to explore the chart.
The training error falls from 0.753 to 0.261, while the validation error stays between about 0.40 and 0.50 after the first epochs. The network keeps fitting the training images without improving on unseen ones: with 540 training images, the data limit what this architecture can learn. The saved model is the one at epoch 100.
5. Model selection and threshold
Five configurations were trained on the same split and compared by their final validation error. The testing images were not used for this choice.
| Candidate | Configuration | Final validation error |
|---|---|---|
| No regularization | Default network, Adam, learning rate 0.0001, 100 epochs | 0.482 |
| L2 regularization 0.01 (selected) | Same, with L2 weight 0.01 | 0.451 |
| Higher learning rate | No regularization, learning rate 0.001 | 0.476 |
| Shorter training | No regularization, 50 epochs | 0.464 |
| Hidden dense layer | 128 ReLU neurons after flatten (23.0 million parameters) | 2.989 (training failed) |
The first four candidates differ by at most 0.031, which is within the epoch-to-epoch fluctuation of the validation error (up to 0.08), so the choice among them is weak; the selected model keeps the regularization. The larger network with a hidden layer of 128 neurons did not train: its error stayed near 3 and its malignant score saturated at 0 for every image checked.
Decision threshold
Melanomas are 19% of the training images, so the model’s scores are low: the median malignant score is 0.075 for benign and 0.171 for malignant testing images. The default threshold of 0.5 therefore flags very few images. The threshold was set on the validation images, as the point of the validation ROC curve closest to perfect classification: 0.11, with validation ROC AUC 0.750, sensitivity 76.5% and specificity 65.8%.
Baseline. Predicting “benign” for every image is correct for 143 of the 180 testing images (79.4% accuracy) but detects no melanoma. Accuracy alone is therefore not a useful measure here.
6. Clinical validation
The final model is evaluated once on the 180 testing images: 37 malignant (20.6%) and 143 benign. Neural Designer reports a testing ROC AUC of 0.739. Calculated from the same scores, the 95% confidence interval is about 0.64–0.84 (Hanley–McNeil).
ROC curve of the testing images with the chosen threshold marked. Enable JavaScript to explore the chart.
Operating point at threshold 0.11
| Actual / predicted at 0.11 | Flagged (malignant) | Not flagged (benign) | Total |
|---|---|---|---|
| Malignant label | 26 | 11 | 37 |
| Benign label | 45 | 98 | 143 |
| Total | 71 | 109 | 180 |
| Testing metric | Threshold 0.11 | Count-based reading | Threshold 0.5 |
|---|---|---|---|
| Sensitivity | 70.3% | 26 of 37 melanomas flagged | 10.8% (4 of 37) |
| Specificity | 68.5% | 98 of 143 benign lesions not flagged | 97.2% (139 of 143) |
| Precision / observed PPV | 36.6% | 26 of 71 flagged images are melanomas | 50.0% (4 of 8) |
| Observed NPV | 89.9% | 98 of 109 unflagged images are benign | 80.8% (139 of 172) |
| Accuracy | 68.9% | 124 of 180 images classified correctly | 79.4% (143 of 180) |
| F1 score | 0.481 | Harmonic mean of precision and sensitivity | 0.178 |
At 0.5 the model behaves almost like the all-benign baseline: same accuracy, and only 4 of 37 melanomas detected. At 0.11 it detects 26 of 37 melanomas, at the cost of 45 false alarms among 143 benign lesions. On the testing images, the ROC point closest to perfect classification lies at a threshold of 0.13. That value is descriptive only, because it was found on the testing data.
7. Workflow and reproducibility
A responsible real-world analogue would begin after a lesion has entered an approved clinical pathway. It would check image quality and format, calculate a versioned score, and route flagged and unflagged lesions alike to clinician review, with histopathology as the reference where indicated.
Calculating outputs for new images
Neural Designer’s Calculate outputs task scores one image at a time. The two testing images below show one melanoma above the threshold and one benign lesion below it.
Example 1
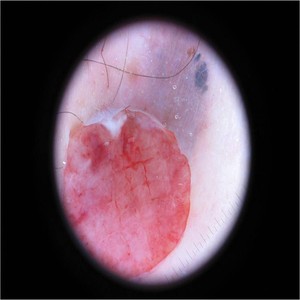
malignant/ISIC_0000004.bmp (testing subset, malignant label)Malignant score: 0.8151
Flagged: the score is above the threshold of 0.11.
| Class | Output score |
|---|---|
| benign | 0.1849 |
| malignant | 0.8151 |
Example 2
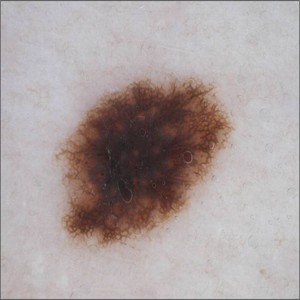
benign/ISIC_0000028.bmp (testing subset, benign label)Malignant score: 0.0209
Not flagged: the score is below the threshold of 0.11.
| Class | Output score |
|---|---|
| benign | 0.9791 |
| malignant | 0.0209 |
These are illustrative outputs for images already counted in the testing metrics. The scores are uncalibrated.
Reproduce the example
The ZIP contains the 900 prepared images, the manifest, the trained Neural Designer 8.0.1 model (model/melanoma.ndm and its parameter file), the Neural Designer inference script and scores.csv with the malignant score of every image and its subset. All the metrics above can be recalculated from scores.csv. To score a new image prepared in the same way, run:
model\melanoma_predict.bat lesion.bmp --tableThe script reports its predicted class at 0.5; apply the 0.11 threshold to the malignant score instead. To retrain, create an image-classification project in Neural Designer from the melanoma_dataset_bmp folder, keep the default network and use the training settings in Section 4. Neural Designer draws a new random split and initialization, so the results will vary; the saved split is listed in model/melanoma.ndm and scores.csv.
8. Safety, generalizability and governance
- Internal random split only. Training, validation and testing images come from the same release. No external hospital, device, time period or prospective cohort is evaluated.
- Patient grouping cannot be verified. The release has no patient identifiers, so related lesions may appear in more than one subset, which can make internal results optimistic.
- Few melanomas in the test. With 37 testing melanomas, each missed case changes sensitivity by 2.7 percentage points, and the confidence interval of the AUC is wide.
- Challenge selection, not a clinical population. The 19% melanoma share reflects how the challenge images were collected. Predictive values change with prevalence.
- Image preparation. Downsampling to 300 × 300 discards fine dermoscopic structure, the resize distorts non-square images, and no color or artifact normalization is applied.
- Uncalibrated scores. A threshold of 0.11 shows that the scores are not probabilities of melanoma.
- No subgroup evidence. Skin type, age, sex, anatomical site and acquisition device are not available in the release, so performance across them is unknown.
- No clinical-utility evaluation. The example does not compare with dermatologists or measure the effect on patient outcomes.
References
- ISIC 2016 Challenge, Part 3 training release. International Skin Imaging Collaboration (ISIC). CC0 1.0 Universal.
- Gutman D, Codella NCF, Celebi E, Helba B, Marchetti M, Mishra N, Halpern A. Skin Lesion Analysis toward Melanoma Detection: A Challenge at the International Symposium on Biomedical Imaging (ISBI) 2016, hosted by the International Skin Imaging Collaboration (ISIC). arXiv:1605.01397, 2016.
- Prepared images, trained Neural Designer 8.0.1 model and scores, 6 October 2026 (ZIP).
- More Neural Designer examples