
Classify six synthetic surface patterns
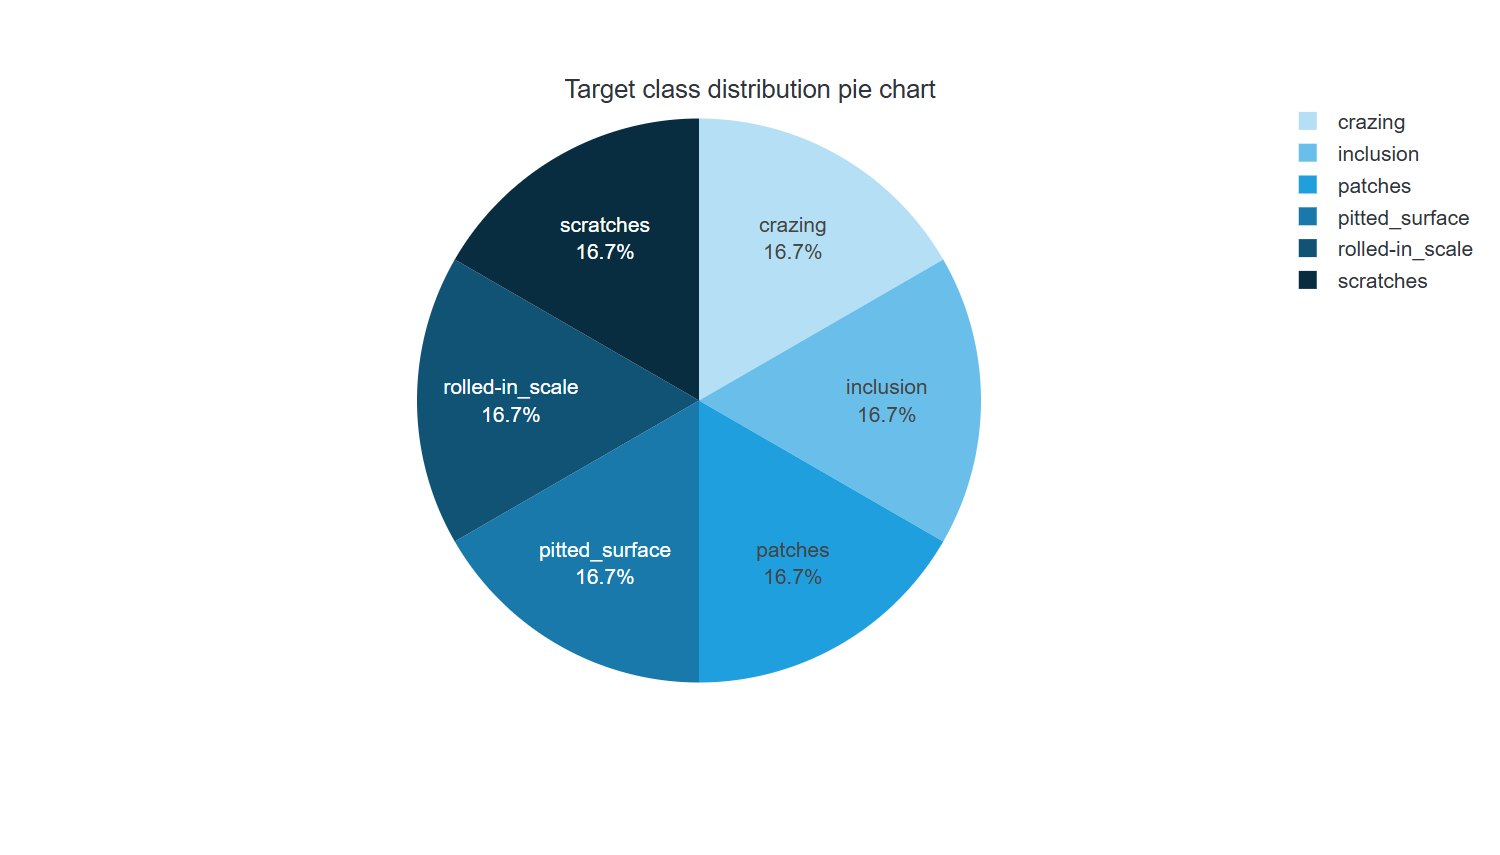
Train an image classifier on 600 steel-like images generated by Artelnics. The six pattern labels are crazing, inclusion, patches, pitted surface, rolled-in scale and scratches.
1. Industrial challenge
Manufacturing teams can use a reproducible image workflow to study class confusion and preprocessing. This example demonstrates image classification using generated textures; it does not measure defect detection on inspected steel.
Six pattern classes
Inspect errors between synthetic categories.
Repeatable generation
Retain the seed-based source generator.
Transfer evaluation
Use real acquisition data for industrial validation.
2. Data set
The dataset contains 100 generated 200 × 200 grayscale images per class. The generation script and CC BY 4.0 notice are included in the project package. These are synthetic patterns, not the former NEU surface-defect photographs.
Source: Artelnics Synthetic Steel Surface Defects. Dataset license: CC-BY-4.0. The downloadable ZIP includes the adapted data and attribution notices.
| Dataset measure | Saved value |
|---|---|
| Analysis unit | generated image |
| Records | 600 |
| Raw variables | 2 |
| Encoded model inputs | 40,000 |
| Model outputs | 6 |
| Training roles | 360 |
| Validation / selection roles | 120 |
| Testing roles | 120 |
| Unused roles | 0 |
| Field | Role | Type | Categories |
|---|---|---|---|
| image | Input | Numeric | |
| Class | Target | Categorical | crazing, inclusion, patches, pitted_surface, rolled-in_scale, scratches |
3. Model
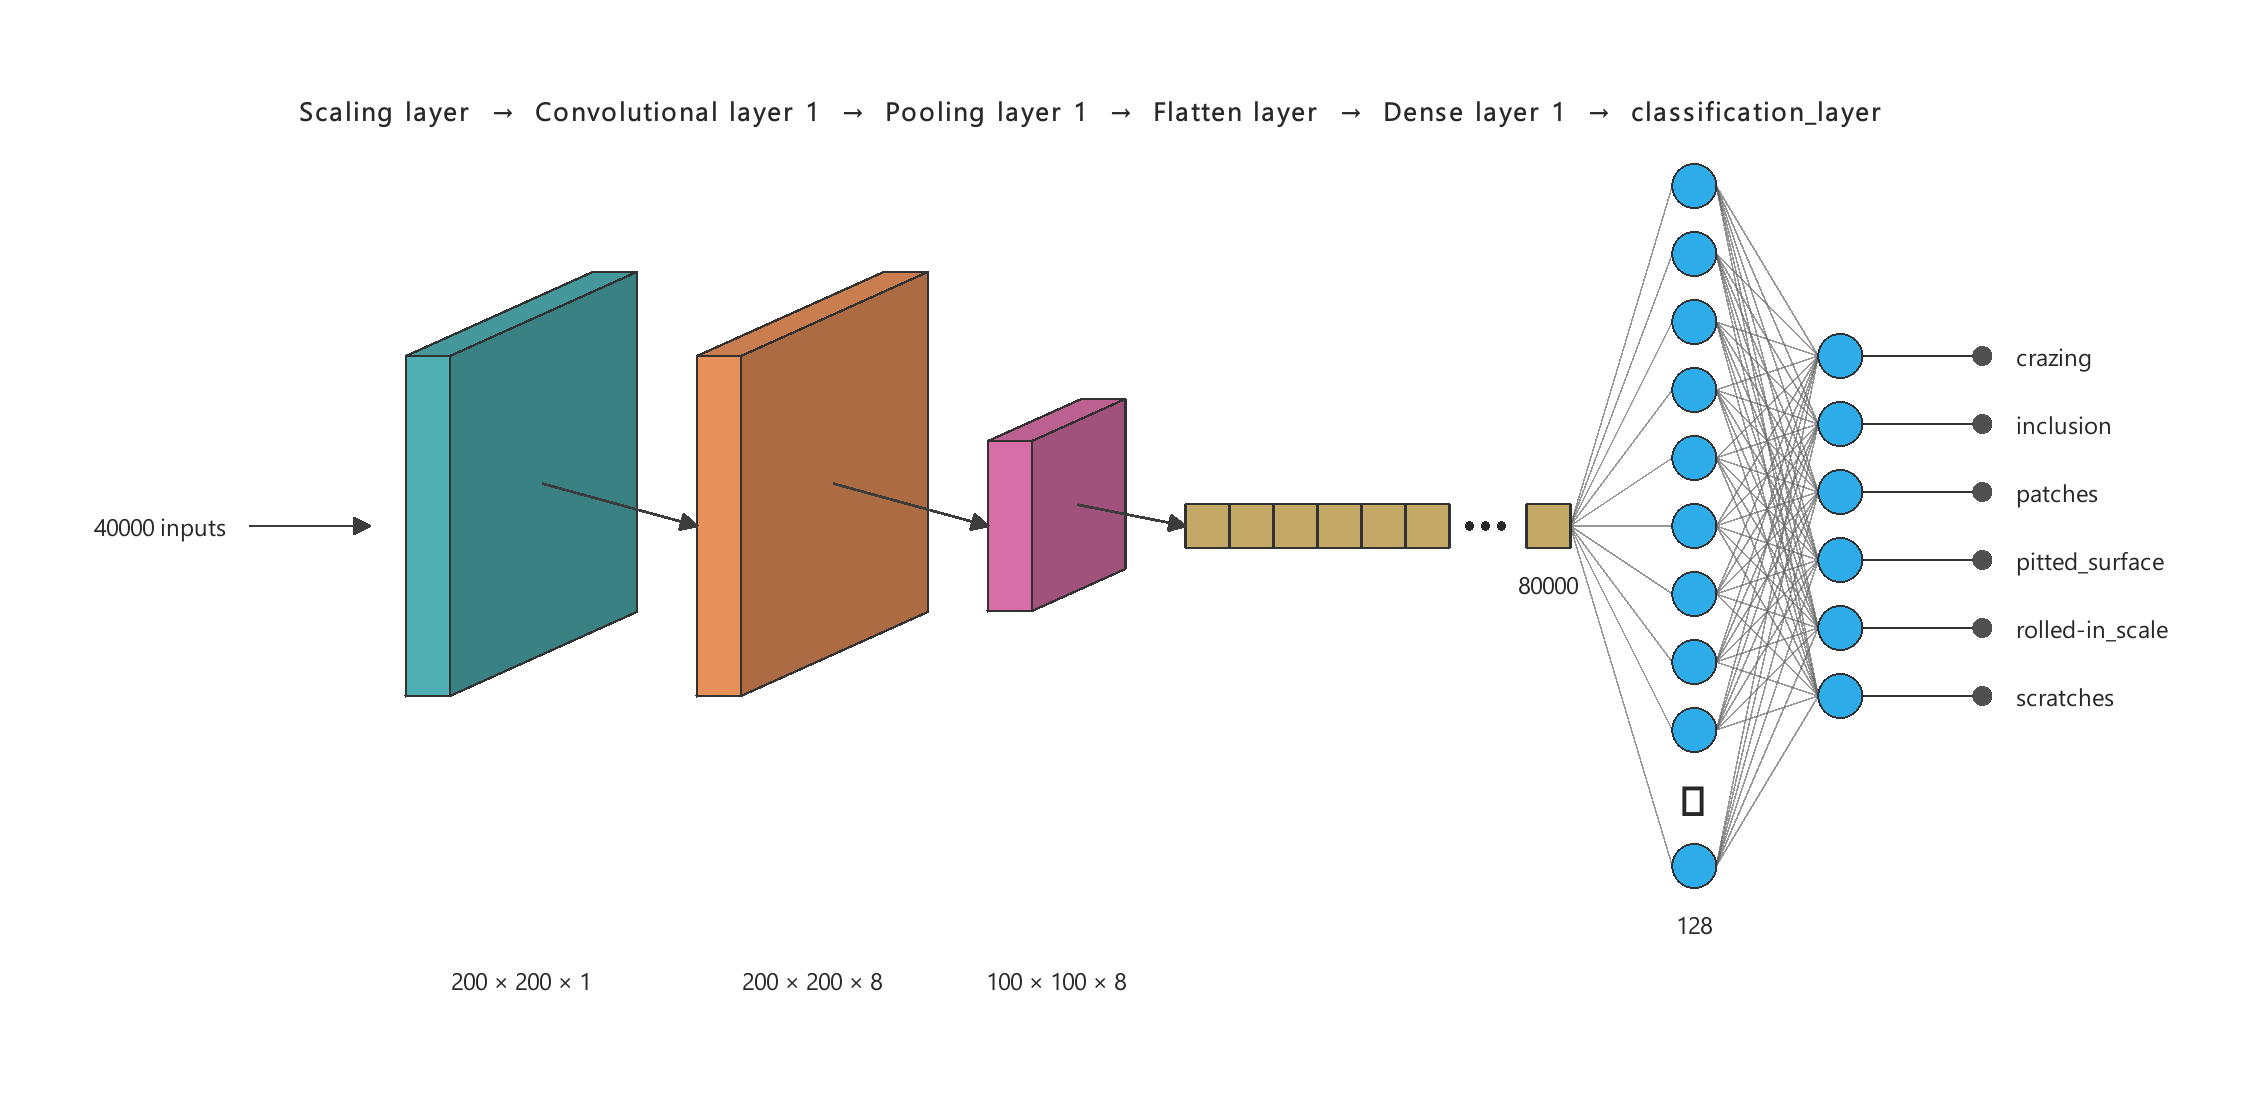
The model has 40000 encoded inputs and 6 outputs. No architecture-selection experiment is recorded in this project. The diagram shows the topology used by the saved model.
| Layer | Input shape | Output shape | Activation |
|---|---|---|---|
| Scaling | 200 × 200 × 1 | 200 × 200 × 1 | |
| Convolutional | 200 × 200 × 1 | 200 × 200 × 8 | ReLU |
| Pooling | 200 × 200 × 8 | 100 × 100 × 8 | |
| Flatten | 100 × 100 × 8 | 80000 | |
| Dense | 80000 | 128 | ReLU |
| Dense | 128 | 6 | Softmax |
Output values are uncalibrated model scores. Use the output encodings and decision rule documented with this project; do not assume independent sigmoid scores sum to one.
4. Training strategy
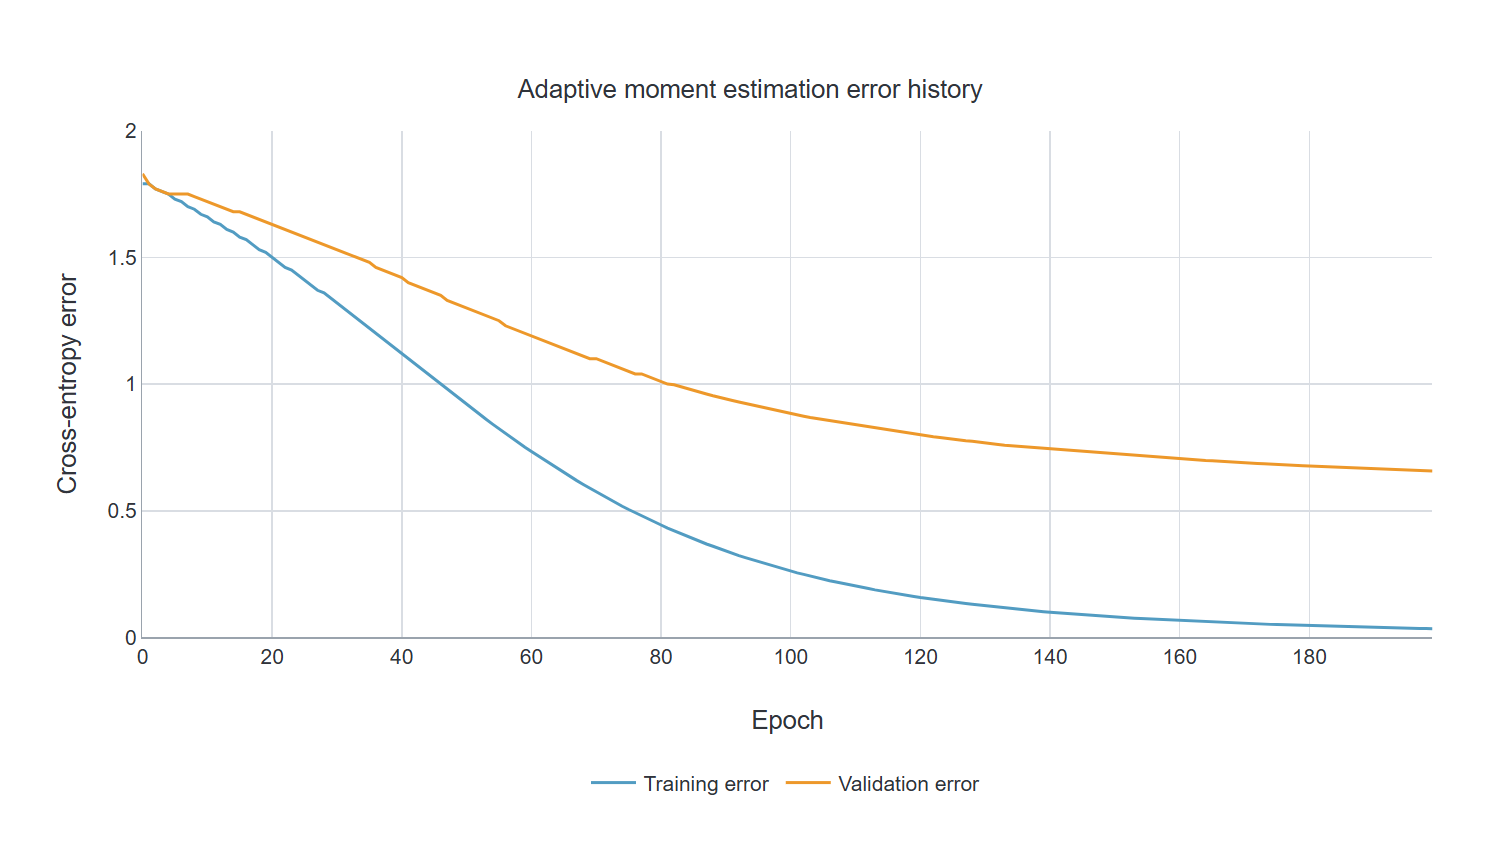
The saved training configuration uses Adam with CrossEntropy.
Adaptive moment estimation results
| Measure | Value |
|---|---|
| Epochs number | 200 |
| Elapsed time | 00:00:06 |
| Stopping criterion | Maximum epochs number |
| Training error | 0.035 |
| Validation error | 0.657 |
5. Model selection
No model selection experiment is recorded for this version. The validation subset guides fitting where a training report is present; it is distinct from the held-out test rows.
6. Testing analysis
The figures and tables below refer to the current project’s saved testing analysis. The subset uses testing role 2; it contains 120 source records.
The multiclass decision uses the largest output score. The confusion matrix gives class prevalence and per-class errors; binary sensitivity, specificity, precision and a single ROC AUC are not interchangeable with this multiclass accuracy.
Confusion table
| Measure | Predicted crazing | Predicted inclusion | Predicted patches | Predicted pitted_surface | Predicted rolled-in_scale | Predicted scratches | Total |
|---|---|---|---|---|---|---|---|
| Actual crazing | 21 (17.5%) | 1 (0.8%) | 0 | 2 (1.7%) | 0 | 0 | 24 (20.0%) |
| Actual inclusion | 0 | 10 (8.3%) | 12 (10.0%) | 0 | 0 | 0 | 22 (18.3%) |
| Actual patches | 0 | 0 | 16 (13.3%) | 0 | 0 | 0 | 16 (13.3%) |
| Actual pitted_surface | 0 | 7 (5.8%) | 0 | 10 (8.3%) | 0 | 0 | 17 (14.2%) |
| Actual rolled-in_scale | 0 | 0 | 0 | 0 | 22 (18.3%) | 0 | 22 (18.3%) |
| Actual scratches | 0 | 0 | 0 | 0 | 0 | 19 (15.8%) | 19 (15.8%) |
| Total | 21 (17.5%) | 18 (15.0%) | 28 (23.3%) | 12 (10.0%) | 22 (18.3%) | 19 (15.8%) | 120 (100.0%) |
| Test measure | Value |
|---|---|
| Testing records | 120 |
| Accuracy | 81.67% |
| Largest-class baseline | 20.00% |
7. Model deployment
Open the downloaded project in Neural Designer, inspect the dataset roles and preprocessing, then review the saved task report. Use the same input schema and category order when calculating outputs. The ZIP contains the exact current .nd, its source data and the applicable dataset notices.
Workflow: source measurements → schema and availability checks → model output → domain review. Keep model versions, validation evidence and incoming-data monitoring together.
8. Scope and limitations
A random split of images from the same generator measures within-generator performance. Validate with independently labelled real surfaces, different acquisition conditions and lot-separated testing before production inspection. Similar appearance does not establish the physical cause of a defect.
References
- Artelnics Synthetic Steel Surface Defects. Artelnics. Not assigned
- Dataset terms: Creative Commons Attribution 4.0 International. Full attribution and transformations are included in
LICENSES/DATASET-LICENSE.txt. - Current Neural Designer project and saved task report, snapshot 6 October 2026.