Studying mortality after heart failure
Can recorded clinical measurements distinguish patients who died during follow-up from those who did not? This example trains an 11-input classifier in Neural Designer and examines its discrimination, missed events and false positives on a held-out test subset.
1. Research question and intended use
The modelling question concerns the recorded outcome in this cohort. It is a reproducible classification exercise for studying clinical data, with explicit attention to score direction and the errors at a chosen threshold.
Recorded outcome
DEATH_EVENT=1 identifies a death observed during follow-up.
Clinical measurements
The model uses 11 demographic, laboratory and clinical inputs.
Held-out evidence
Inspect the ROC curve alongside the 8 missed deaths and 7 false positives at a threshold of 0.5.
2. Cohort, measurements and endpoint
The prepared Heart Failure Clinical Records table contains 299 patient records, with 96 recorded deaths and 203 records without a death event. The endpoint is DEATH_EVENT: 1 means death observed during follow-up; 0 means no death observed during that period. The prepared CSV has 11 predictors and excludes the original follow-up-time column. Follow-up duration varies in the source cohort, so this binary endpoint is not a common fixed-horizon mortality outcome.
The downloadable project, saved report and supplied source CSV define the exact version used here. Repository: original dataset/source record.
| Subset | Records |
|---|---|
| Training | 181 |
| Validation / selection | 59 |
| Testing | 59 |
| Unused | 0 |
| Variable | Role | Type | Encoding | Unit |
|---|---|---|---|---|
| age | Input | Numeric | years | |
| anaemia | Input | Binary | 0; 1 | 0=no; 1=yes |
| creatinine_phosphokinase | Input | Numeric | mcg/L (source convention) | |
| diabetes | Input | Binary | 0; 1 | 0=no; 1=yes |
| ejection_fraction | Input | Numeric | % | |
| high_blood_pressure | Input | Binary | 0; 1 | 0=no; 1=yes |
| platelets | Input | Numeric | kiloplatelets/mL (source convention) | |
| serum_creatinine | Input | Numeric | mg/dL | |
| serum_sodium | Input | Numeric | mEq/L | |
| sex | Input | Binary | 0; 1 | 0=woman; 1=man |
| smoking | Input | Binary | 0; 1 | 0=no; 1=yes |
| DEATH_EVENT | Target | Binary | 0; 1 | 0=no recorded death; 1=recorded death |
Interactive chart: DEATH_EVENT pie chart. Enable JavaScript to explore it.
Interactive chart: DEATH_EVENT Pearson correlations chart. Enable JavaScript to explore it.
3. Model
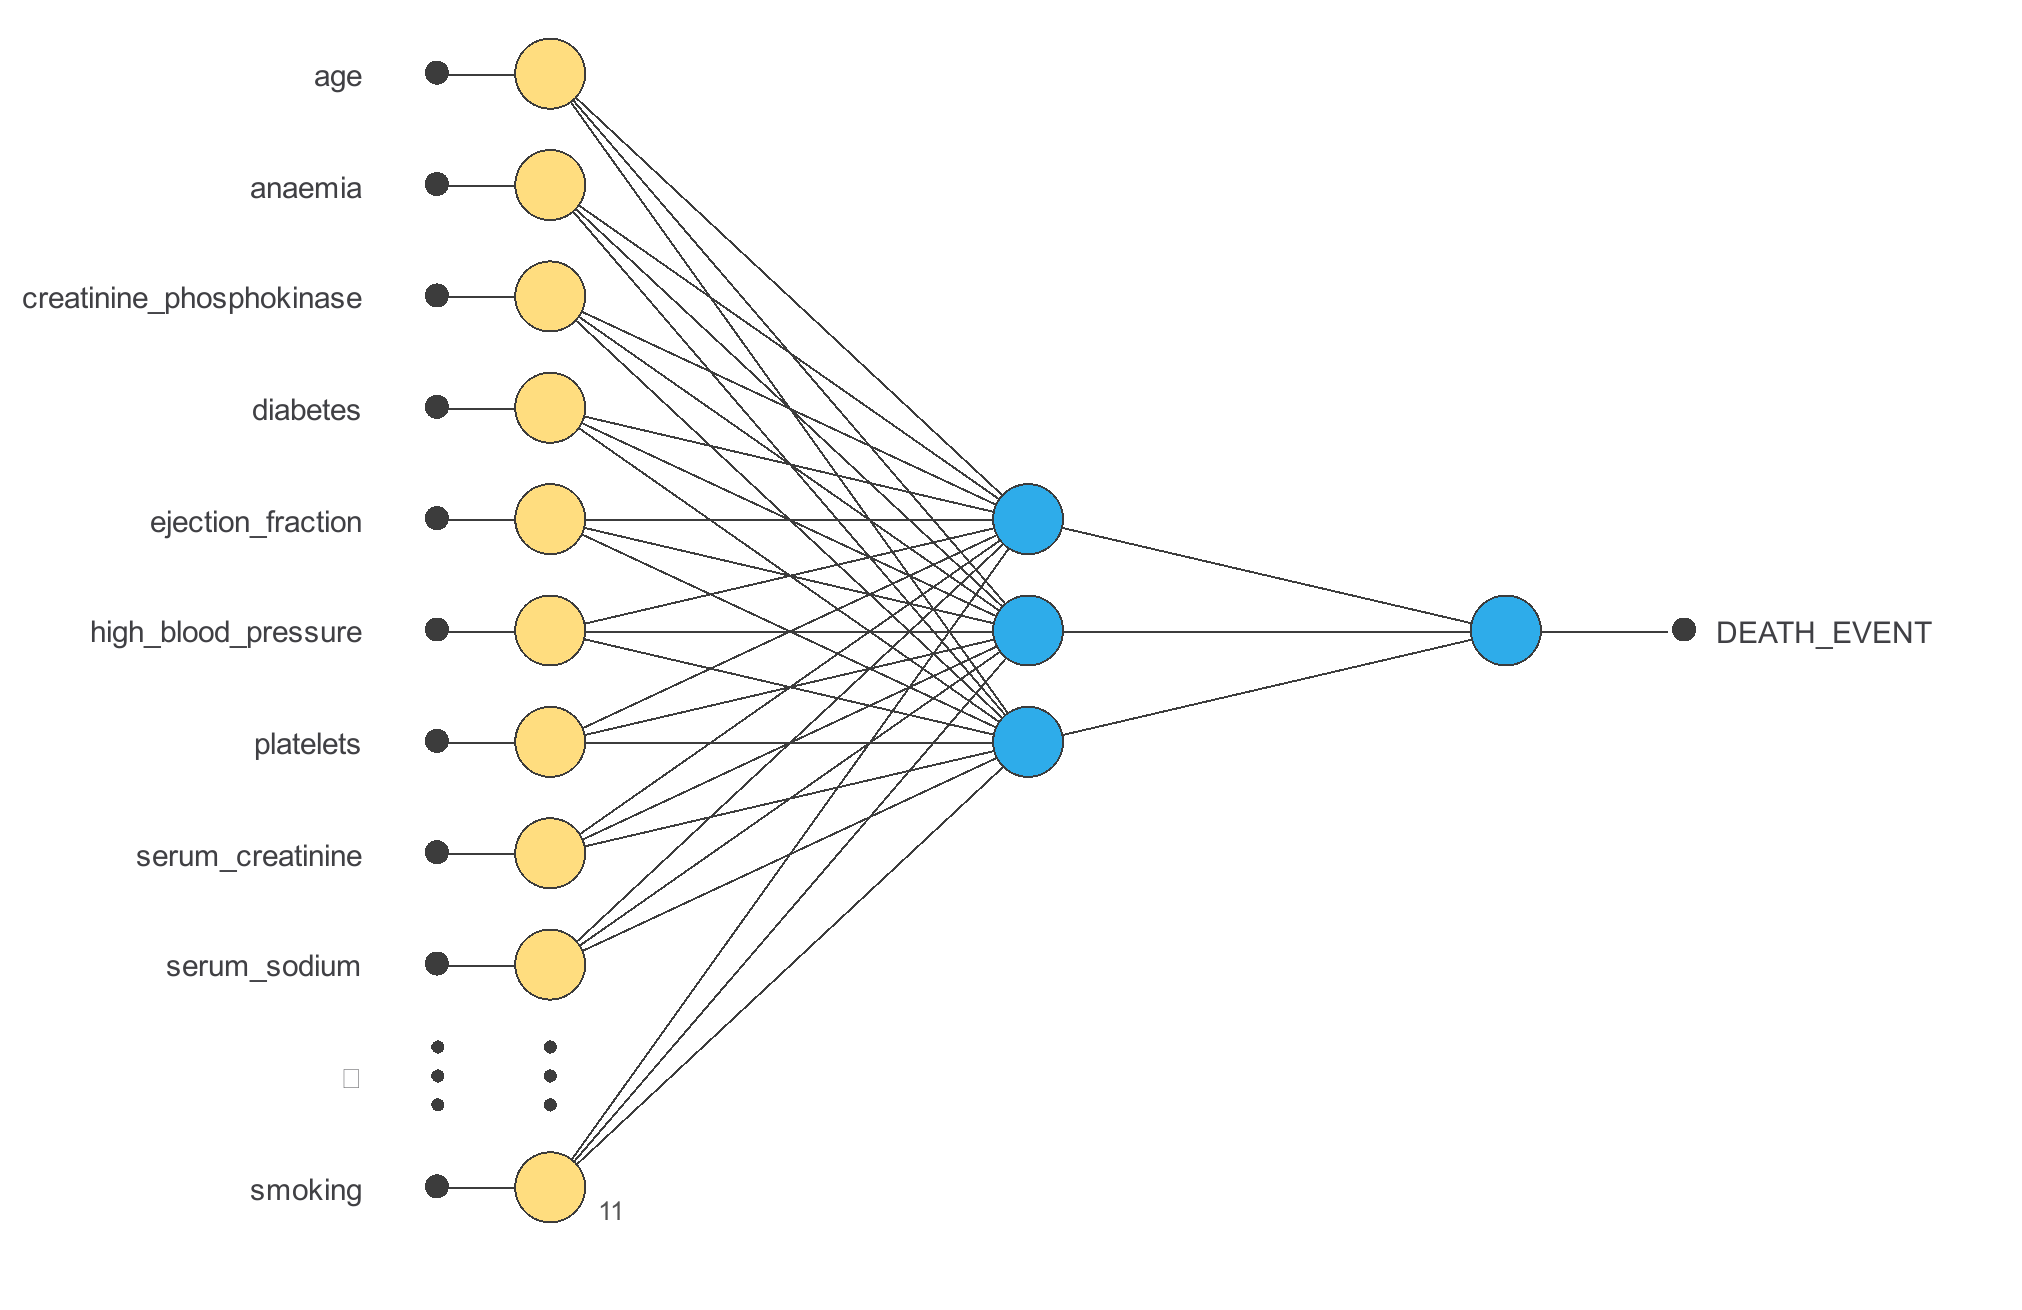
The final model has 11 encoded input features and 1 outputs. The following dimensions describe the final saved network.
| Layer | Input shape | Output shape | Activation |
|---|---|---|---|
| Scaling | 11 | 11 | — |
| Dense | 11 | 3 | Tanh |
| Dense | 3 | 1 | Sigmoid |
Output semantics: the sigmoid score increases toward 1; 0 is the other class. Calibration has not been evaluated, so scores are not presented as calibrated probabilities.
4. Training strategy
Training uses weighted squared error, L2 regularization (weight 0.01) and the Quasi-Newton optimizer. Training minimizes the recorded objective; the validation subset monitors generalization during fitting. The testing subset is used for the evaluation below.
Interactive chart: Quasi-Newton method error history. Enable JavaScript to explore it.
Quasi-Newton method results
| Measure | Value |
|---|---|
| Epochs number | 111 |
| Elapsed time | 00:00:00 |
| Stopping criterion | Maximum validation error increases |
| Training error | 0.592 |
| Validation error | 0.741 |
5. Model selection and baseline
No model selection experiment is recorded in this supplied project. The displayed architecture is the trained model used for testing; earlier article claims about a different selected architecture do not apply to this version.
A transparent test-set comparator is the majority-class rule, with accuracy 67.8%. This is a baseline for interpretation, not an alternative model fitted on the test labels.
6. Testing and interpretation
In the test subset, 19 of 59 patients have DEATH_EVENT=1 (32.2%). At the 0.5 threshold, the model identifies 11 of these events and misses 8; it also flags 7 of the 40 records without a death event. For the death-event class, sensitivity is 57.9%, specificity 82.5% and positive predictive value 61.1%.
The final classifier is evaluated on 59 testing records. The confusion counts below were reproduced from the saved model. Rows are actual classes and columns are predicted classes. The decision threshold is 0.5 on the score for 1.
Test class prevalence is shown by the support counts. Accuracy is 74.6% and macro F1 is 0.705. ROC AUC is 0.776. The native ROC optimal threshold is descriptive of this test set and is not an independently validated operating policy.
| Actual / predicted | 0 | 1 | Total |
|---|---|---|---|
| 0 | 33 | 7 | 40 |
| 1 | 8 | 11 | 19 |
| Class | Test cases | Sensitivity / recall | Specificity | Precision / PPV | F1 |
|---|---|---|---|---|---|
| 0 | 40 | 82.5% | 57.9% | 80.5% | 0.815 |
| 1 | 19 | 57.9% | 82.5% | 61.1% | 0.595 |
The native ROC task reports AUC 0.776 with 90% confidence limits 0.661–0.891. Its test-derived threshold of 0.382 gives sensitivity 73.7% and specificity 75.0% on these same cases. This exploratory cutoff was not selected on an independent validation set; the confusion matrix above retains the default threshold of 0.5.
Interactive chart: ROC chart. Enable JavaScript to explore it.
7. Workflow and reproducibility
Check inputs → apply the saved preprocessing and network → obtain a DEATH_EVENT score → review the research result. The ZIP contains the original project, source CSV, schema, test metrics and standalone interactive chart exports. The project hash in the schema identifies this exact version.
Explore the exported model
This research demonstration runs locally in your browser. Values outside the saved input range are outside the validated domain and are rejected. Plausible individual values do not guarantee that their combination is represented in the cohort.
The output is an uncalibrated score for DEATH_EVENT=1, not a personal mortality probability. It must not guide medical treatment.
8. Safety, generalizability and governance
The 59-record test subset is small and comes from the same historical cohort as the training records. This binary classifier does not model event time or censoring and cannot provide a validated 30-day or one-year mortality risk. Before any medical use, establish predictor availability at the assessment time, refit preprocessing within training, evaluate on an independent cohort and obtain clinician review.
No external validation or independent calibration study is included. The saved scaling statistics cover the cohort rather than a separately verified training-only preprocessing fit. Preprocessing statistics and model choices should be refitted within a prospective or grouped validation design. Correlations and directional responses describe associations, not causes. Human review is required before an operational decision.
The saved ROC task provides an AUC confidence interval, but subgroup performance, calibration curves and decision-cost validation are not established by these tasks. Predictive values apply to the observed test class distribution and may change when prevalence shifts.
References
- Ahmad et al., original cohort data accompanying the 2017 PLOS ONE study.
- Heart Failure Clinical Records, UCI Machine Learning Repository (2020), CC BY 4.0. This prepared CSV omits follow-up time; the original records are credited to their source.