The original data in this example is stored in the GDC web, where the Cancer Genome Atlas (TCGA) Research Network has profiled and analyzed large numbers of human tumors to discover molecular aberrations at the DNA, RNA, protein, and epigenetic levels.
We will use the Neural Designer free version to answer the previous question. You can download a free trial here.
Introduction
A pathway status describes a series of chemical reactions where cellular molecules work together to control a cell function, such as cell division or death.
For example, cells receive a signal from their environment when a molecule joins a specific protein receptor on or in the cell. After the first molecule in the pathway receives a signal, it activates another molecule. This process of sequential activation is repeated along the signaling pathway until the last molecule is activated and the function is carried out.
However, the abnormal activation of pathways may lead to diseases such as cancer. In this example, we will be focused on the RTK/RAS/PI3K pathway:

This molecular genetic axis controls critical cellular functions and is commonly altered in various cancers. Perturbations across this pathway can lead to deficiencies in the cell cycle, survival, metabolism, motility, and genome stability, triggering cancer hallmark phenotypes.
Specifically, we will look at KRAS mutations. So, if KRAS is mutated, we consider the pathway to be altered. At this point, can we predict whether a pathway is altered based on gene expression data alone?
Materials and methods
Dataset
This dataset analyzes large numbers of human tumors to discover molecular aberrations at the DNA, RNA, protein, and epigenetic levels made by the TCGA. This information is reported for 9,074 patients and 33 different cancer types. We will focus on the expression data obtained by RNA-seq and the mutational data.
We will download the data from Zenodo, where the raw files have been processed to tabular format. Subsequently, we will use the files for the expressions (pancan_rnaseq_freeze.tsv.gz) and the mutations file (pancan_mutation_freeze.tsv.gz).

The final merged data has 9074 rows, corresponding to patients suffering from one of the 33 cancer types that TCGA reports. Each patient also has expression data for 20501 genes, and a binary variable indicating whether this patient has the pathway altered.
This variable was calculated considering KRAS mutations. Therefore, if this gene is mutated in a patient, we assume the pathway is altered.
Next, we will split our data into two subsets: genes inside the pathway and genes outside the pathway. This gene list is taken from Kegg.
We filter our data and divide it into 350 and 20151 gene datasets corresponding to genes inside or outside the pathway. Also, we will maintain samples where only KRAS is mutated and where neither of the three genes of the pathway is mutated. In the end, we have 7,803 samples.
Once we have these two datasets, we will follow the Neural Designer workflow to generate two models for each dataset.
Model development
First, as we compare the two models, we will use the same optimization algorithm, loss index, and network structure for robustness.

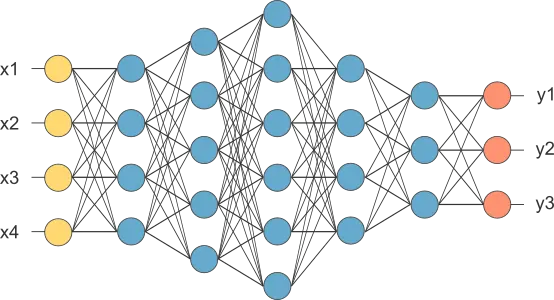
We will use a network with genes as input variables and a scaling layer with the same number of neurons as the number of inputs we have in each case. We will use ten neurons with the hyperbolic tangent as the activation function for the perceptron layer.
This number of neurons results from previous testing with the data to obtain better model regularization. Finally, our probabilistic layer with one neuron gives us the probability of the pathway being altered.
In the training strategy, we will use the Weighted squared error for the loss index because we have a varying group size for the predicted variable (703 vs. 7100). In addition, we will use the Quasi-Newton method for the optimization algorithm, as it is the standard for classification problems.
Finally, we will use feature selection on our network to reduce the input genes to a more manageable size.
Results
We have built two models for each of the subsets mentioned above. In this model, we use gene expression of a subset of genes to predict whether or not the target pathway is altered.
Model for genes inside the pathway
In this model, we have the genes that are inside the pathway. We can predict whether or not the pathway is altered with these genes. The genes included are: AKT3, AREG, BCL2, CREB3L1, EFNA2, EFNA3, EFNA4, EPHA2, EREG, FGF18, FGF19, FGFR4, GHR, GNG7, IL2RG, IL7, INS, ITGA2, ITGB4, ITGB6, ITGA7, LAMA3, LAMB3, LAMC2, MAGI2, MYB, NGFR.
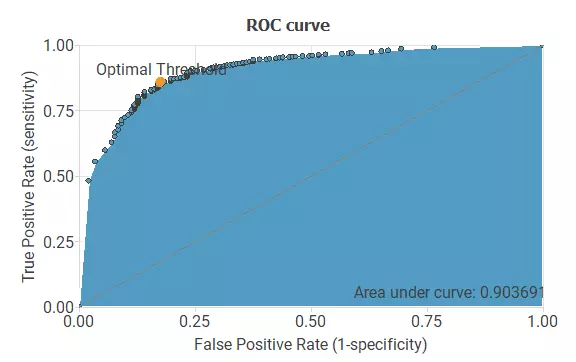
Next, we will use a ROC curve to assess if our model performs adequately. The ROC curve is a standard method for testing a neural network using an independent subset of the original data in binary classification applications. It plots the false positive rate (or 1 – specificity) on the X-axis and the true negative rate (or sensitivity) on the Y-axis for different decision threshold values. The following figure shows the ROC curve for the genes inside the pathway model:

As we can see in the previous image, we have a good ROC curve, indicating a working model. For this ROC curve, we obtain the following confusion matrix, where we represent how the testing samples are classified with our model:
| τ=0.5 | Predicted positive | Predicted Negative |
|---|---|---|
| Real positive | 102 (6.53%) | 39 (2.5%) |
| Real negative | 153 (9.8%) | 1266 (81.15%) |
We obtain the model’s specificity and sensitivity from this matrix: Sensitivity: 0.72, Specificity: 0.89. All this information implies that this model works as intended, and we can obtain good results.
Model for genes outside the pathway
In this model, we have the genes that are outside the pathway. We can predict whether or not the pathway is altered with these genes. The genes included are: ALPP, AP3B2, BTNL8, BSPRY, C3orf54, C10orf81, C10orf95, C10orf108, C11orf53, C14orf50, C14orf72, C15orf48, C17orf73, C19orf22, C19orf33, C19orf45, C20orf118, C20orf151, CDIPT, MLKL, RAB11FIP1, SDCBP2, SLC44A4, SMPDL3B, SPATA12, SPRY2, SRPK1.
Next, we will use a ROC curve to assess if our model performs adequately. The following figure shows the ROC curve for the genes inside the pathway model:
As we can see in the previous image, we get a good ROC curve, indicating a working model. Also, we get a slightly better ROC curve than in the previous model.
Moreover, the confusion matrix for this model:
| τ=0.5 | Predicted positive | Predicted Negative |
|---|---|---|
| Real positive | 93 (5.9%) | 45 (2.88%) |
| Real negative | 135 (8.6%) | 1287 (82.5% |
Also, this model has a slightly worse sensitivity but a better specificity than the previous model: Sensitivity: 0.67, Specificity: 0.90.
Ultimately, we have two working models: genes inside the case study pathway and genes outside.
Discussion
We have built two models that perform similarly, which is shocking, as we are trying to predict mutation in a specific gene. We would expect the model with genes of the same pathway to perform better, as it should add more information about genes not in the same pathway.
However, we found that the second one, with genes not in the pathway, performs slightly better. So now we can ask ourselves, how does that make sense? Is there any information that the neural network can see that we do not know? In this case, we could delve more into this topic and perform an extensive biological analysis, but what if we keep it simple?
Our approach is knowing that we have two sets of genes that interact with KRAS in some way; why don’t we represent this interaction as a network? We have used Cytoscape and Genemania addon to build a network using these two gene lists:

In the network, the genes are represented by color depending on their status in the pathway. For example, in red are the genes inside the pathway, in blue are those outside it, in dark grey are the three central genes of the pathway, and in grey are additional genes added by Genemania to the network. Also, the circles represent significant subnetworks within the whole network.
The existing links between each network node represent if they are coexpressed and how significant this coexpression is. A pair of coexpressed genes implies that two genes have a similar pattern in their expression. Also, we have data about pathways inside our network, physical and genetic interactions, co-localization, predicted interactions, and shared protein domains. Ultimately, the most significant information from our data is the coexpression network we built.
Thus, with this analysis, we have found an explanation for how our models perform similarly. Furthermore, the neural network can detect this pattern and extract relevant information to build a successful model. So, in the end, we obtain two models that can predict if the pathway is altered. Therefore, KRAS is mutated only from expression data.