In this post, we explain the primary methods for handling missing values in machine learning and when to use each one.
A common challenge when applying neural networks to real-world problems is that datasets are often incomplete.
To address this, you can either remove the samples with missing values or replace them with simple statistics such as the variable’s mean.
However, no single method is always the best choice, so you should study your dataset carefully to decide which approach gives the best results.
Contents
Introduction
Usually, missing values are denoted by a label in the data set.
Some standard labels used for representing missing values are NA (not available), NaN (not a number), Unknown, or ?.
Using numeric values, such as -999, is not recommended as they could be mistaken for real values.
Throughout this work, we will choose the label NA to denote a missing value.
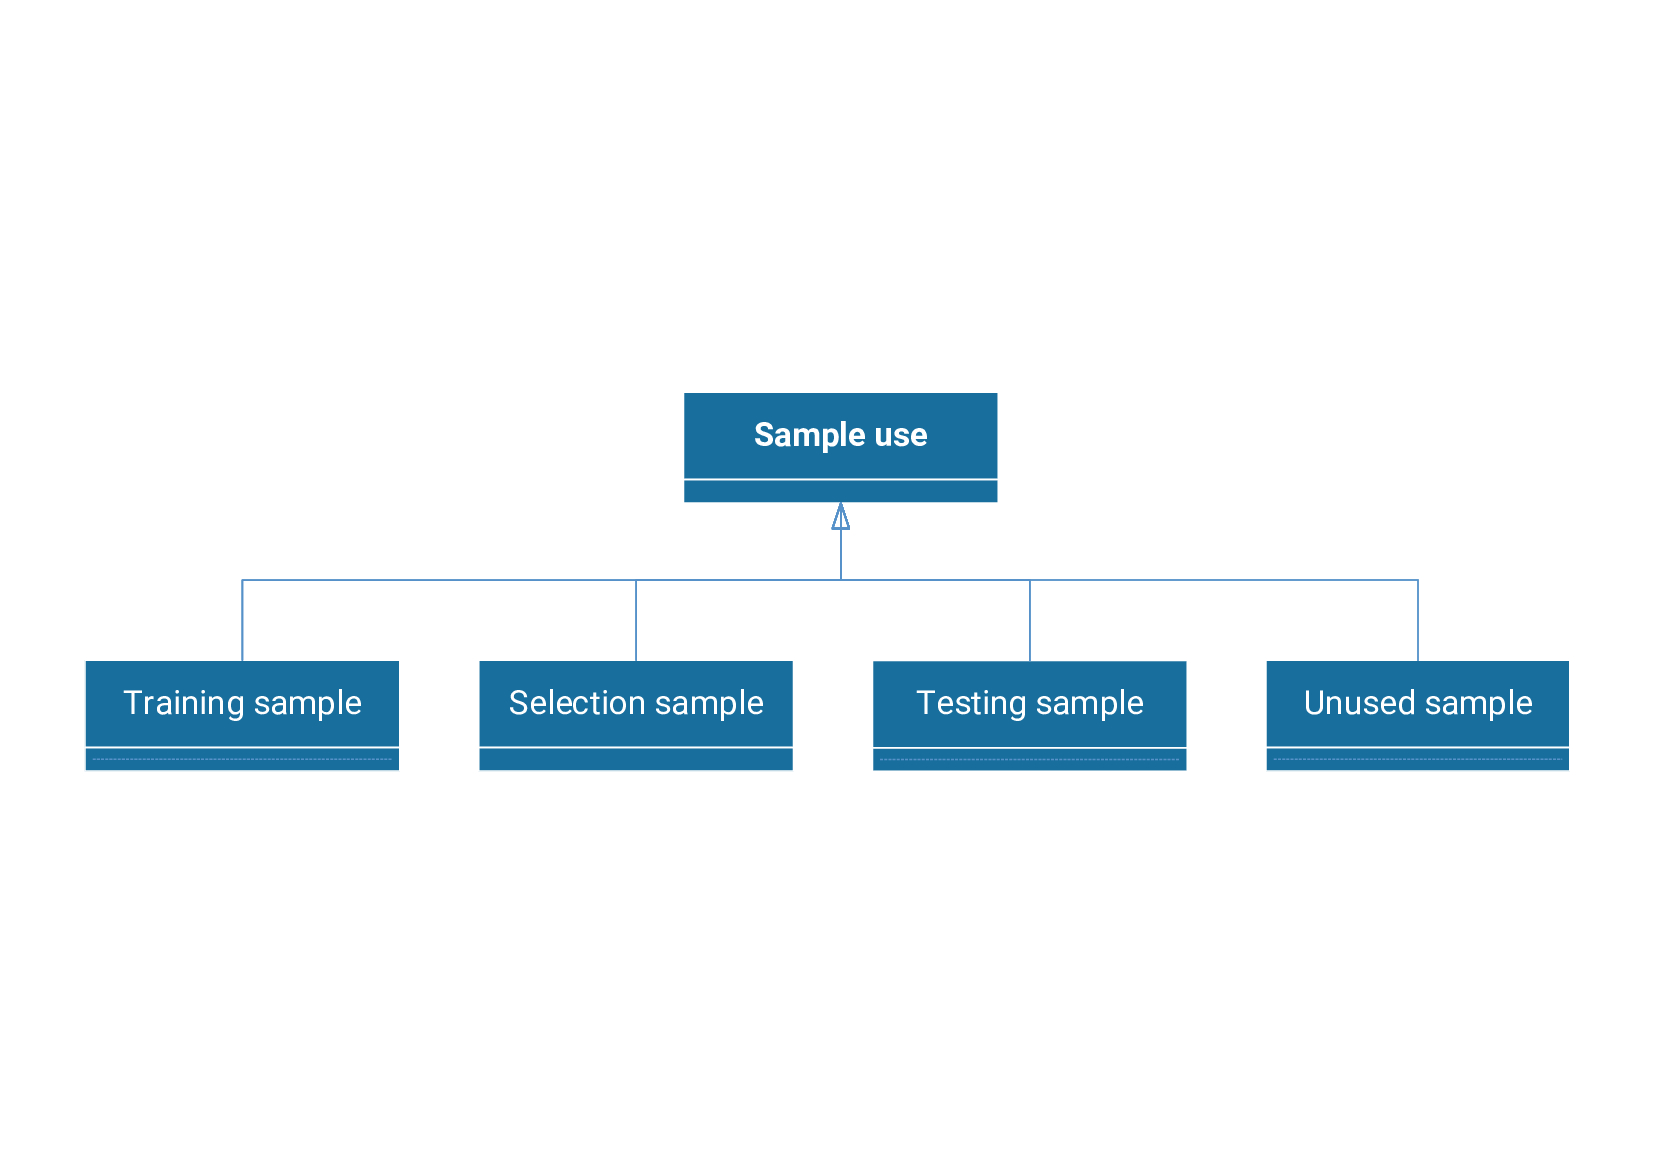
2. Samples unusing
This method sets samples as unused if they have missing values, thereby excluding them from the analysis in the machine learning model.
ui = unused, if ui contains NA, i=1,…,p.
We can use it when the number of samples in the data set is large, and the number of missing values is negligible compared to the number of samples.
Example: Samples unusing
A hospital has conducted a study to predict which treatment produces the best survival in patients with colon cancer after surgery.
How well a patient does after surgery depends on how much residual cancer remains.
This example examines data from a randomized controlled trial (RCT) measuring the effect of a particular drug combination on colon cancer.
The study data set has samples from 607 patients and 12 variables.
| ID | Sex | Age | Obstruction | Perforation | … | Outcome |
|---|---|---|---|---|---|---|
| 1 | male | 43 | no | no | … | die |
| 2 | male | 63 | no | no | … | survive |
| … | … | … | … | … | … | … |
| 928 | female | 48 | yes | no | … | survive |
The total number of missing values is 17.
| Missing values | Missing samples |
|---|---|
| 17 (0%) | 17 (2%) |
Since the number of missing values is negligible in the number of samples we have, we can eliminate the samples containing missing values from the analysis.
After removing the samples containing missing values, we are left with a dataset with 590 samples.
3. Data imputation
In some cases, almost all samples used in machine learning models contain missing values, and choosing the first method would significantly lose information.
If the data set is small or the number of missing values is considerable, you cannot afford not to use samples with missing values.
In such cases, assigning probable values to the missing data is advisable.
In this sense, imputation replaces missing data with estimated data.
The most common imputation method replaces missing values with the mean value of the corresponding variable.
In some situations, the median or the mode is used instead of the mean as the imputation value.
dij = vjmean, if dij = NA, i=1,…,p, j=1,…,q.
It is convenient to conduct a preliminary analysis of the data to determine when to replace missing values with the mean or median.
If the variable is numerical but has outliers or asymmetric data, it is advisable to replace the missing values with the median.
On the contrary, if the variable is numerical and has no outliers, it is advisable to choose the median value of the data.
Example: Data imputation
A Portuguese bank institution aims to predict which bank clients will subscribe to a long-term deposit and which will not.
The data set used is related to the direct marketing campaigns of a Portuguese bank institution.
We have a dataset with 16 variables and 4120 samples.
A total of 8350 (12%) missing values and 3591 (87%) missing samples have been recorded.
| Missing values | Missing samples |
|---|---|
| 8350 (12%) | 3591 (87%) |
We would lose too much information if we eliminated all samples with missing values.
To solve the problem, we must conduct a thorough analysis of the data and replace the missing values with the most reasonable estimate.
We can decide whether to replace missing values with the mean or the median by calculating the data statistics.
| Variable | Maximum value | Minimum value | Mean | Median |
|---|---|---|---|---|
| age | 87 | 19 | 41.22 | 39 |
| education | 3 | 1 | 2.15 | 2 |
| balance | 71182 | -3313 | 1439.81 | 422 |
| contact_type | 1 | 0 | 0.09 | 0 |
| last_contact | 871 | 1 | 223.67 | 189 |
| previous_conversion | 1 | 0 | 0.20 | 0 |
Taking into account the statistical results and observing no outliers, we can replace the missing values with the mean of the corresponding variable.
4. Time series data interpolation
This method can be helpful to impute missing values in time series.
If we have a dataset with a time series containing missing values, we can give it values by performing interpolation.
However, if several consecutive values are missing in a data set column, the interpolation in that period will be less accurate.
Example:
An oil company collects production data from oil wells. Analysis of this data is essential to maximize production and detect potential problems.
In the dataset, we have a variable representing the daily volume of oil in cubic meters.
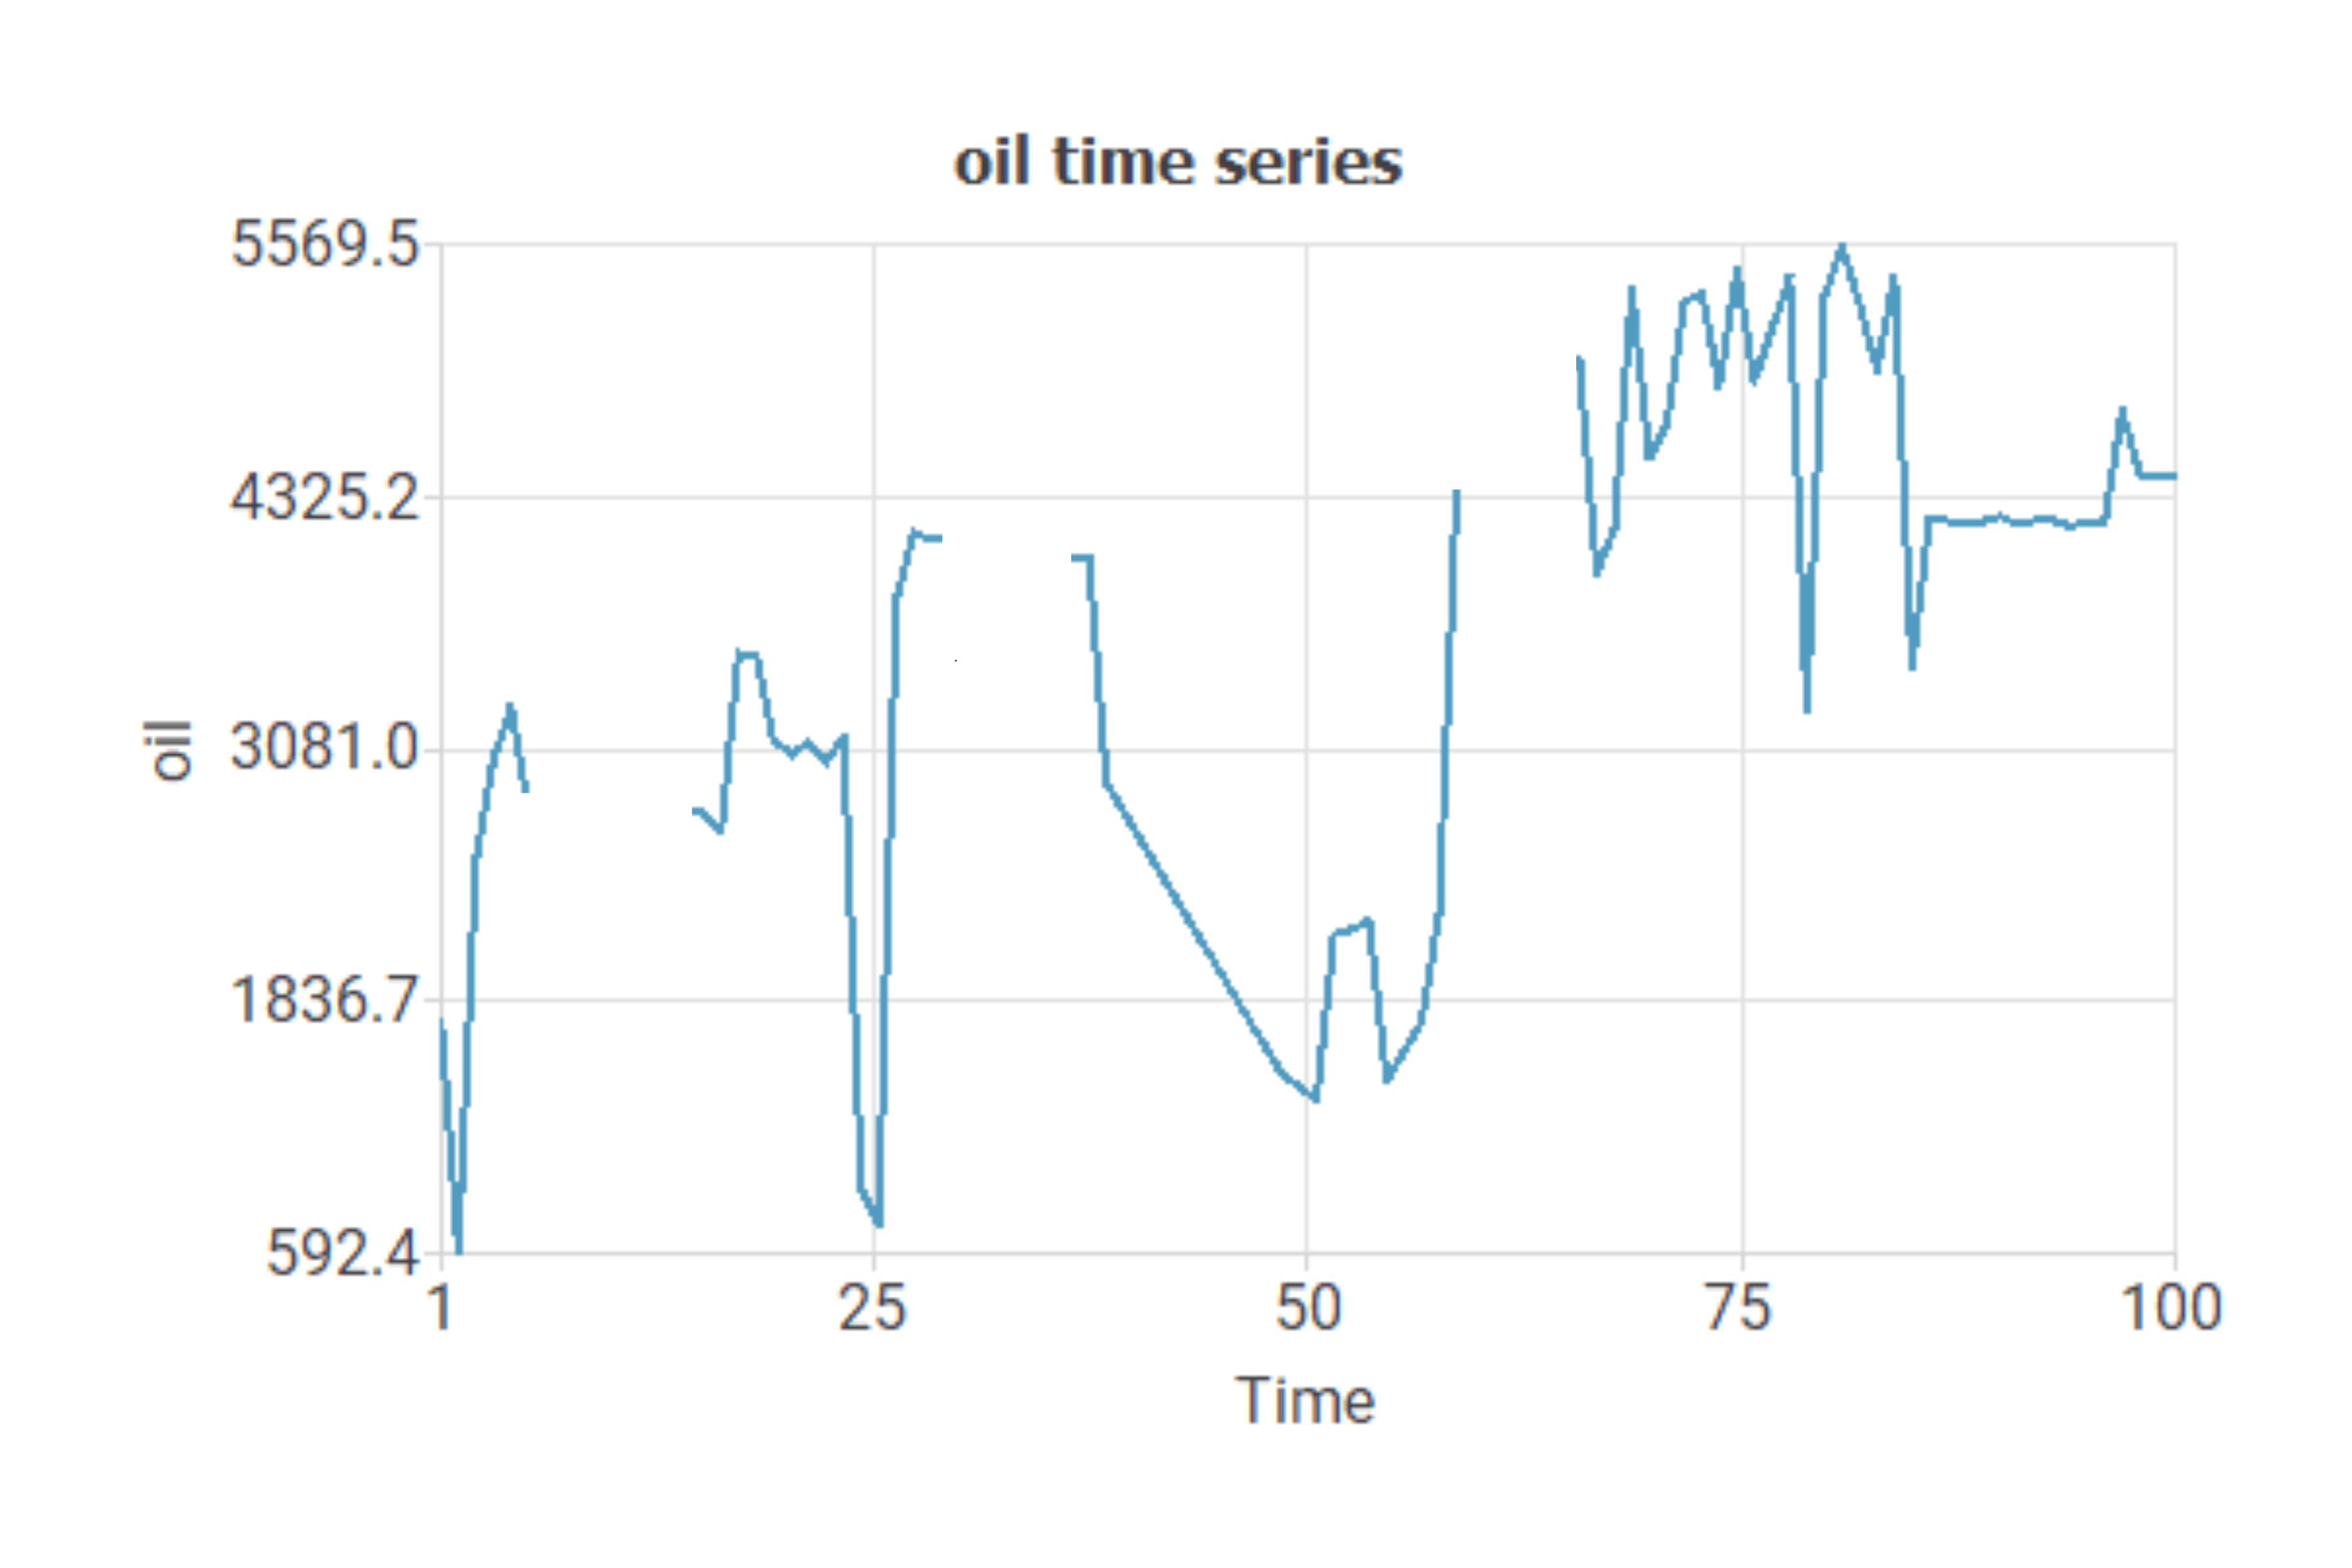
This chart shows the missing values in the dataset
To treat these missing values, interpolation is carried out.
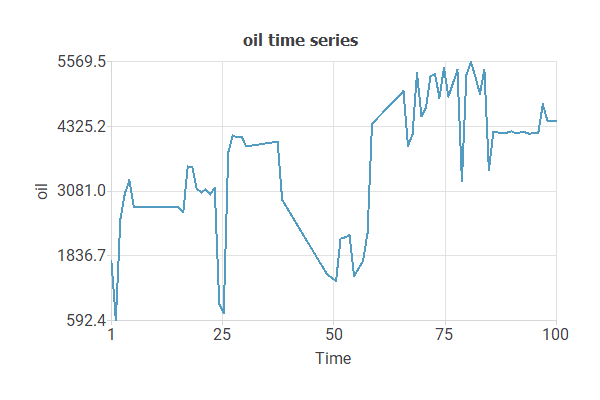
This chart shows the interpolation applied to missing values.
5. Conclusions
Missing values are entries in the data matrix that are not available.
To build a model, you can either remove the samples with missing values or replace them with simple statistics such as the mean or median.
More advanced techniques, like nearest-neighbor imputation, can also be applied.