In this post, we explain what advanced analytics is.
Nowadays, the amount of data created and stored in organizations is increasing significantly.
Due to this large amount of information, new business opportunities continuously rise.
However, most organizations are stuck in lower-value descriptive analytics. But more sophisticated analysis can bring great business value.
Contents
Objectives
Advanced analytics is the set of techniques used to discover relationships, recognize patterns, predict trends, and find associations in your data.
The objective is to use internal and external sources of information to obtain valuable insights that result in smarter decisions and better business outcomes.
These methods allow us to know what happened in our company, why did it happen, what will happen and how we can make something happen. The following figure illustrates the whole advanced analytics process.
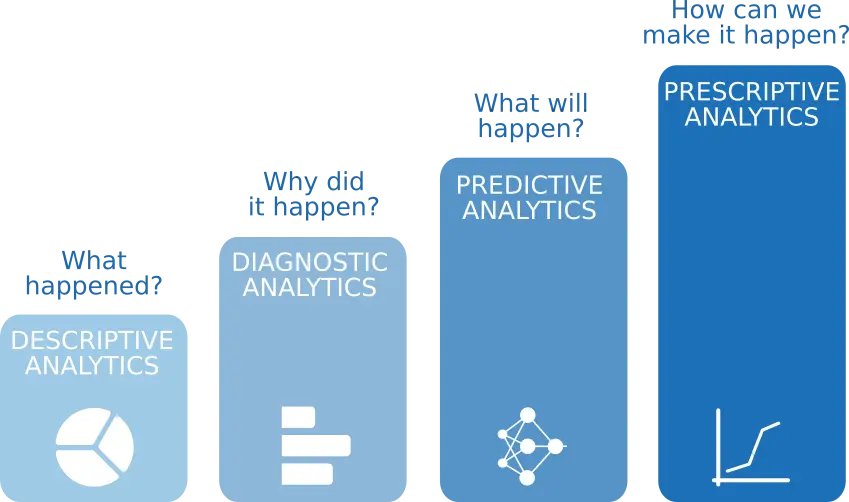
As we can see, the advanced analytics process comprises 4 phases: descriptive, diagnostic, predictive, and prescriptive analytics. Each of these phases is more complex than the previous one but provides more value.
1. Descriptive analytics
Descriptive analytics is the first stage of advanced analytics. It answers the question: What happened?.
In this phase, we obtain insights regarding the general aspects of the company. The output is a set of tables and charts with historical information about operations, sales, customers, etc.
Some of the analyses carried out at this stage are:
Statistics
Statistics provide very valuable information. Indeed, they put the data set in context.
The most important statistical parameters are the minimum, the maximum, the mean, and the standard deviation.
The table below illustrates these parameters for the total amount of money spent by a customer in an online store.
| Minimum | Maximum | Mean | Standard deviation | |
|---|---|---|---|---|
| Total amount (USD) | 12 | 500 | 51 | 56 |
As we can see, each customer has spent an average of 51 USD, but some people have spent up to 500 USD.
Distributions
Distributions show how the data is arranged over its entire range.
Histograms show the distribution of continuous variables. A normal (gaussian) or uniform distribution is, in general, desirable.
For example, the following figure depicts a histogram for the age of our customers.
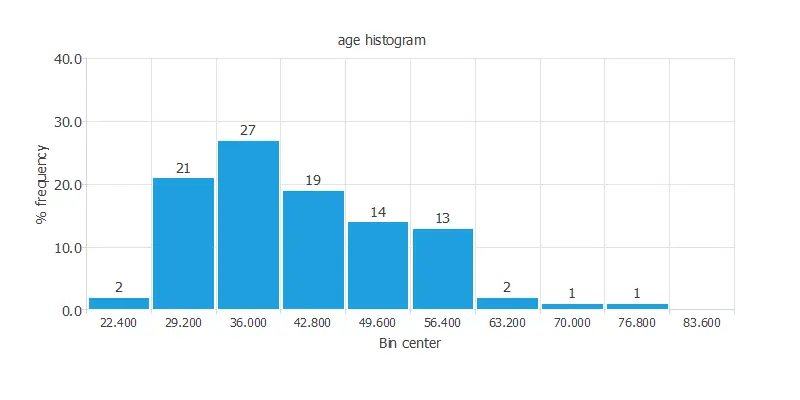
As we can see, most of our customers are between 30 and 40 years old.
Pie charts show the distribution of binary or nominal variables.
The following figure shows the pie chart for the customers that purchased a product from an online store during the last marketing campaign. This is a binary variable.
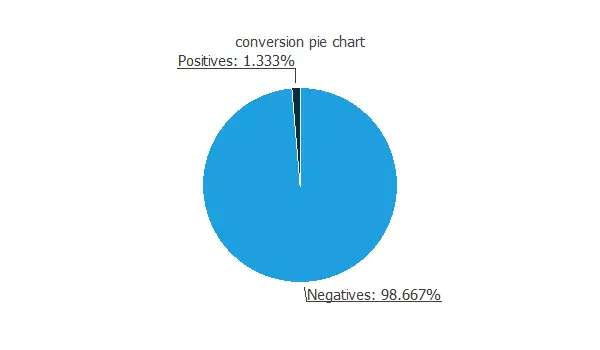
As we can see, only 1% of the people that see our ad buy the product.
2. Diagnostic analytics
Diagnostic analytics is the second phase of advanced analytics. It answers the question Why did it happen?.
Diagnostic analytics allows determining the factors that contributed to the outcome.
Here we concentrate on the following techniques:
Scatter charts
Scatter charts might help discover dependencies between the output and input variables.
This charts plot of output values versus input values.
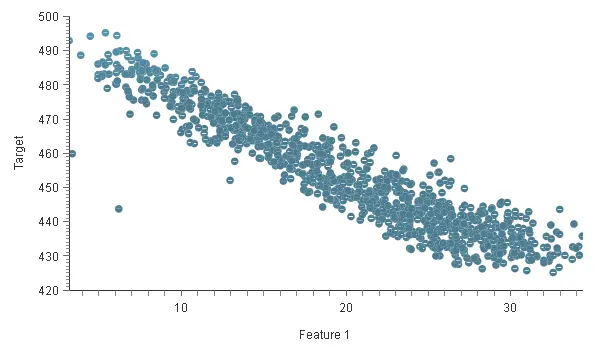
The chart above shows that as the value of Feature 1 increases, the value of Target decreases.
Correlations
Correlations are also helpful for discovering dependencies between input and output variables.
A correlation is a numerical value between 0 and 1 that expresses the strength of the relationship between two variables.
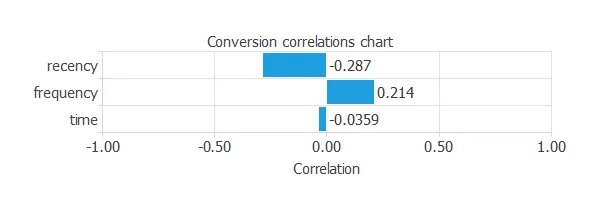
The maximum correlation obtained (-0.287) is between the recency and the conversion. Such a high correlation indicates that we have to study this variable more thoroughly.
3. Predictive analytics
Predictive analytics is the third stage of advanced analytics. It answers the question: What will happen?
Predictive analytics allows identifying the likelihood of future outcomes based on historical data.
This is the most critical phase of the analysis; its output is a predictive model capable of knowing what will happen in the future.
It encompasses various machine learning techniques such as k-nearest neighbors, decision trees, neural networks, etc.
We explain these techniques below.
K – Nearest neighbors
K-nearest neighbors is a very simple method used for classification and approximation.
It stores all available cases and classifies new cases based on a similarity measure.
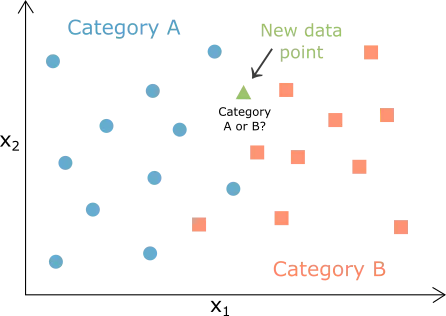
The chart above shows that the algorithm classifies many data points into A (blue circles) and B (orange squares).
A new data point is introduced (green triangle). The k-nearest neighbors’ method decides, based on the similarity between them, if the point belongs to category A or category B.
Decision trees
Decision trees are also a simple method used for classification and approximation.
A decision tree is a mathematical model helping you to choose between several courses of action. It estimates probabilities to calculate likely outcomes.
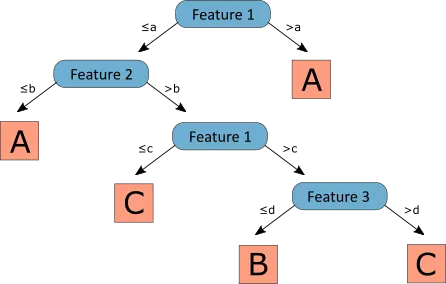
In the diagram above, we can see an example of a decision tree. Feature 1, Feature 2, and Feature 3 are three numerical features of the dataset; A, B, and C are the three categories in which the instances are classified; and a, b, c, and d are numerical values.
We start on the top to classify an instance and follow the tree’s branches with our sample values. First, we check the instance’s value for Feature 1, if it is greater than a, it would be classified in category B, and we would be done. If it is equal to or less than A, we have to check the value for Feature 2 and if it is greater or less than the value B. We follow this process until we reach a leaf category (A, B, or C).
Neural networks
Neural Networks are recognized as one of the most powerful machine learning methods.
They are used in classification and approximation tasks.
Neural networks are computational models based on the neural structure of the brain.
The outputs from the neural network depend on the inputs fed to it and the different parameters within the neural network.
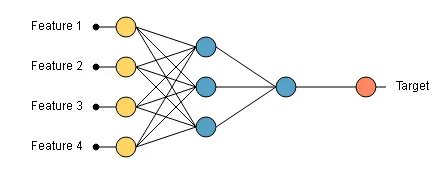
The graph above shows a neural network with four inputs (feature 1, 2, 3, and 4). When we introduce the values of the four features in the neural network, we get an output.
4. Prescriptive analytics
Prescriptive analytics is the fourth and last step of advanced analytics. It answers the question How can we make it happen?.
It consists of applying the predictive model to determine the best solution or outcome among various choices.
In this phase, we predict what will happen in the future using our predictive model to show the decision-maker the implications of each option.
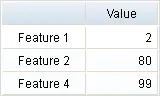
For instance, we propose two different scenarios to see how the target varies as a single input function, depending on Feature 3.
The next table shows the reference variables for the first scenario.
The following plot shows the output Target as a function of the input Feature 3. The x and y axes are defined by the range of Feature 3 and Target, respectively.
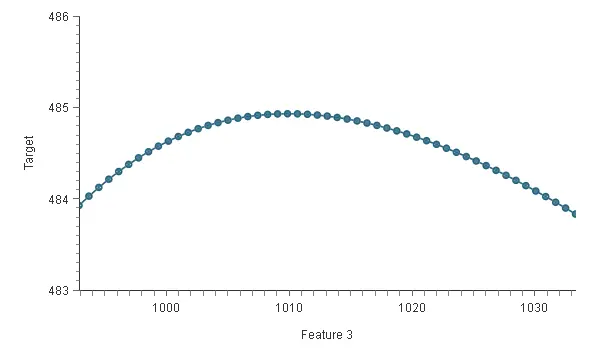
The chart above shows that when Feature 3 is 1010, Target reaches its maximum 484.93.
Conclusions
As seen in this post, simple analytics are not enough to get actionable insights and improve business operations.
Thanks to Advanced Analytics, you will not leave anything to chance. It includes a global vision from the past to the possible futures given in your company.
The data science and machine learning platform Neural Designer contains many utilities to perform descriptive, diagnostic, predictive, and prescriptive analytics easily.
You can download Neural Designer now and try it for free.