Introduction
Human activity recognition (HAR) using machine learning can support healthcare applications by analyzing smartphone movement data to detect daily activities.
In this study, 30 volunteers (aged 19–48) performed six activities while a waist-worn smartphone recorded accelerometer and gyroscope data at 50 Hz, with video labeling for accuracy.
Healthcare professionals can test this approach with Neural Designer’s trial version.
Contents
The following index outlines the steps for performing the analysis.
1. Model type
- Problem type: Multiclass classification (walking, walking_upstairs, walking_downstairs, sitting, standing, lying)
- Goal: Model the probability of each activity based on input variables to support healthcare applications such as patient monitoring, rehabilitation, and lifestyle management.
2. Data set
Data source
The file activity_recognition.csv contains 10299 samples, each of them with 561 inputs and one categorical target.
Variables
The following list summarizes the variables’ information:
Sensor signals – Time and frequency domain
body_acceleration (x, y, z) – Linear acceleration of the body along 3 axes.
gravity_acceleration (x, y, z) – Gravity component of acceleration along 3 axes.
body_acceleration_jerk (x, y, z) – Rate of change of body acceleration.
body_angular_speed (x, y, z) – Angular velocity of the body from gyroscope measurements.
body_angular_acceleration (x, y, z) – Rate of change of angular velocity.
body_acceleration_magnitude – Magnitude of body acceleration vector.
gravity_acceleration_magnitude – Magnitude of gravity acceleration vector.
body_acceleration_jerk_magnitude – Magnitude of body acceleration jerk vector.
body_angular_speed_magnitude – Magnitude of angular speed vector.
body_angular_acceleration_magnitude – Magnitude of angular acceleration vector.
Target variable
activity – The human activity performed during data collection: Walking, Walking Upstairs, Walking Downstairs, Sitting, Standing, and Lying.
Variables distributions
Variable distributions can be calculated; the figure shows the number of samples for each activity in the dataset.
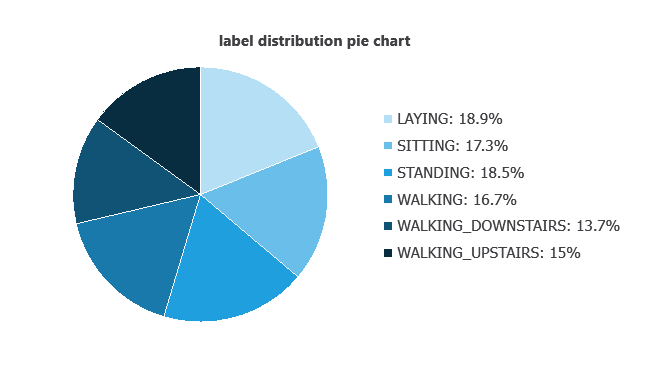
As we can see, the number of instances belonging to each category is similar. Therefore, this data set exhibits good balance.
Input-target correlations
The input-target correlations indicate which sensor signals most influence the classification of activities and, therefore, are more relevant to our analysis.
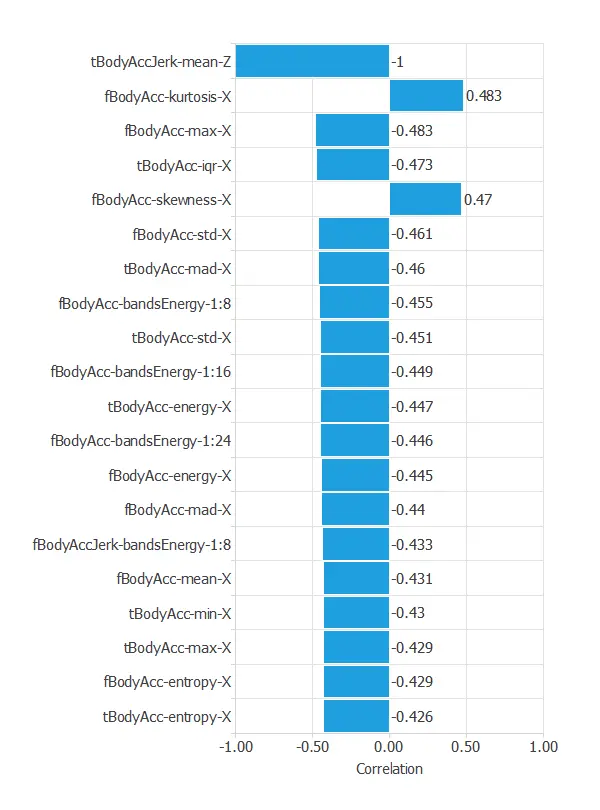
The most correlated variables with activity classification are tBodyAccJerk-mean-Z, fBodyAcc-kurtosis-X, and fBodyAcc-max-X.
3. Neural network
A neural network is an artificial intelligence model inspired by how the human brain processes information.
It is organized in layers: the input layer receives the variables, the hidden layers combine them to detect relevant patterns, and the output layer provides the probability of belonging to a given class.
Trained with historical data, the network learns to recognize patterns and distinguish between categories, offering objective support for decision-making.
The network processes the smartphone sensor signals, combines them in hidden layers, and outputs the probability for each activity class.
The connections illustrate how the different sensor variables contribute to the classification.
4. Training strategy
Training a neural network uses a loss function to measure errors and an optimization algorithm to adjust the model, ensuring it learns from data while avoiding overfitting for good performance on new cases.
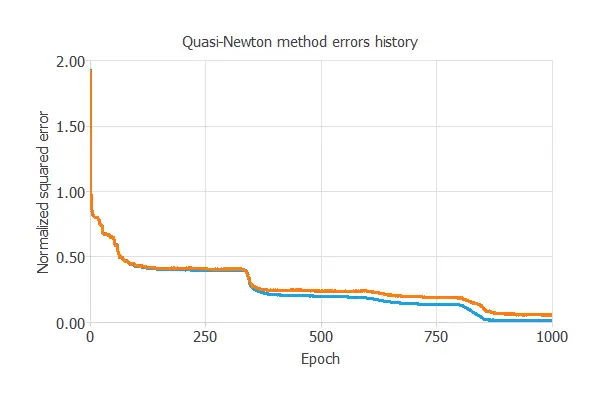
The model was trained for accuracy and stability, with training and selection errors decreasing steadily (0.008 and 0.048 NSE), indicating effective learning and generalization to new activity instances.
5. Testing analysis
Once the model is trained, we perform a testing analysis to validate its prediction capacity.
In particular, we use a subset of data that has not been used before, the testing instances.
Confusion matrix
The confusion matrix shows the model’s performance by comparing predicted and actual activities. It includes:
True positives: activities correctly identified
False positives: activities incorrectly identified as another class
False negatives: activities that were missed or misclassified
True negatives: activities correctly recognized as not belonging to a given class
| Predicted STANDING | Predicted SITTING | Predicted LAYING | Predicted WALKING | Predicted WALKING DOWNSTAIRS | Predicted WALKING UPSTAIRS | |
|---|---|---|---|---|---|---|
| Real STANDING | 376 | 18 | 0 | 0 | 0 | 0 |
| Real SITTING | 18 | 330 | 1 | 0 | 0 | 0 |
| Real LAYING | 0 | 2 | 402 | 0 | 0 | 0 |
| Real WALKING | 1 | 0 | 0 | 307 | 0 | 0 |
| Real WALKING DOWNSTAIRS | 0 | 0 | 0 | 0 | 279 | 1 |
| Real WALKING UPSTAIRS | 1 | 0 | 0 | 0 | 5 | 318 |
In this example, 97.72% of cases were correctly classified and 2.28% were misclassified.
6. Model deployment
Once validated, the neural network can be saved for deployment, allowing predictions of human activities from new accelerometer and gyroscope data.
In deployment mode, researchers can use it as a real-time or offline recognition tool, with Neural Designer automatically exporting the model for easy integration into laboratory or application workflows.
Conclusions
The human activity recognition model achieved excellent performance, correctly classifying 2012 of 2059 instances (2.3% misclassification).
Key features—such as Z-axis body acceleration jerk, frequency-domain acceleration, and maximum X-axis acceleration—align with biomechanical principles.
With strong generalization, this neural network can support healthcare professionals in monitoring activity, developing health apps, and providing personalized lifestyle and rehabilitation recommendations.
References
- UCI Machine Learning Repository Human Activity Recognition Using Smartphones Data Set.
- Davide Anguita, Alessandro Ghio, Luca Oneto, Xavier Parra, and Jorge L. Reyes-Ortiz. A Public Domain Dataset for Human Activity Recognition Using Smartphones. 21st European Symposium on Artificial Neural Networks, Computational Intelligence, and Machine Learning, ESANN 2013. Bruges, Belgium 24-26 April 2013.