
Detect internal pump-leakage patterns in hydraulic test-rig cycles
A 17-input autoencoder learns a normal baseline from no-leak hydraulic test-rig cycles and ranks held-out cycles by reconstruction error. The final saved model reaches ROC AUC 0.902. Its automatic threshold is conservative: it flags 246 of 984 labelled leakage cycles and 6 of 245 no-leak cycles, so the score is useful for prioritization but the default operating point misses most leakage examples.
1. Industrial challenge
Internal leakage reduces a hydraulic pump’s volumetric efficiency and can change several measurements at once rather than creating one universal sensor limit. A reconstruction model can rank cycles whose combined pressure, flow, temperature, vibration and motor-power pattern differs from the no-leak baseline. The score supports condition-monitoring review; fault confirmation and maintenance decisions still require operating context and engineering diagnostics.
Rank cycles for internal pump-leakage review rather than claiming a general hydraulic diagnosis.
Report weak and severe leakage separately so aggregate recall does not hide missed early-stage cases.
Choose threshold and persistence from the acceptable inspection workload, then monitor drift and false alerts over time.
2. Data set
The packaged hydraulic_anomaly_detection.csv contains 2,205 complete rows, 17 numeric inputs and one binary evaluation label. A direct comparison with the official UCI files confirms that every row represents one of the test rig’s 60-second load cycles and that each input is the arithmetic mean of one complete sensor channel during that cycle. The packaged rows are reordered, but all 2,205 official cycles are represented once, with no missing or exact duplicate rows.
| Input family | Packaged variables | Physical quantity | Official sampling rate |
|---|---|---|---|
| Pressure | pressure_1_bar–pressure_6_bar | Six pressure channels (bar) | 100 Hz |
| Electrical | motor_power_w | Motor power (W) | 100 Hz |
| Flow | flow_1_l_min–flow_2_l_min | Volume flow (L/min) | 10 Hz |
| Temperature | temperature_1_c–temperature_4_c | Four temperatures (°C) | 1 Hz |
| Vibration | vibration_mm_s | Vibration (mm/s) | 1 Hz |
| Derived process signals | cooling_efficiency_pct, cooling_power_kw, efficiency_factor_pct | Cooling efficiency, cooling power and efficiency factor | 1 Hz |
The binary label also matches the official cycle annotation exactly: pump-leakage class 0 becomes anomaly = 0; weak leakage (class 1) and severe leakage (class 2) become anomaly = 1. Cooler, valve and accumulator conditions are present in the source experiment but are not the reference target in this derived file.
| Subset | No leak | Weak leakage | Severe leakage | Total |
|---|---|---|---|---|
| Training | 732 | 0 | 0 | 732 |
| Validation | 244 | 0 | 0 | 244 |
| Testing | 245 | 492 | 492 | 1,229 |
| Total | 1,221 | 492 | 492 | 2,205 |
3. Model
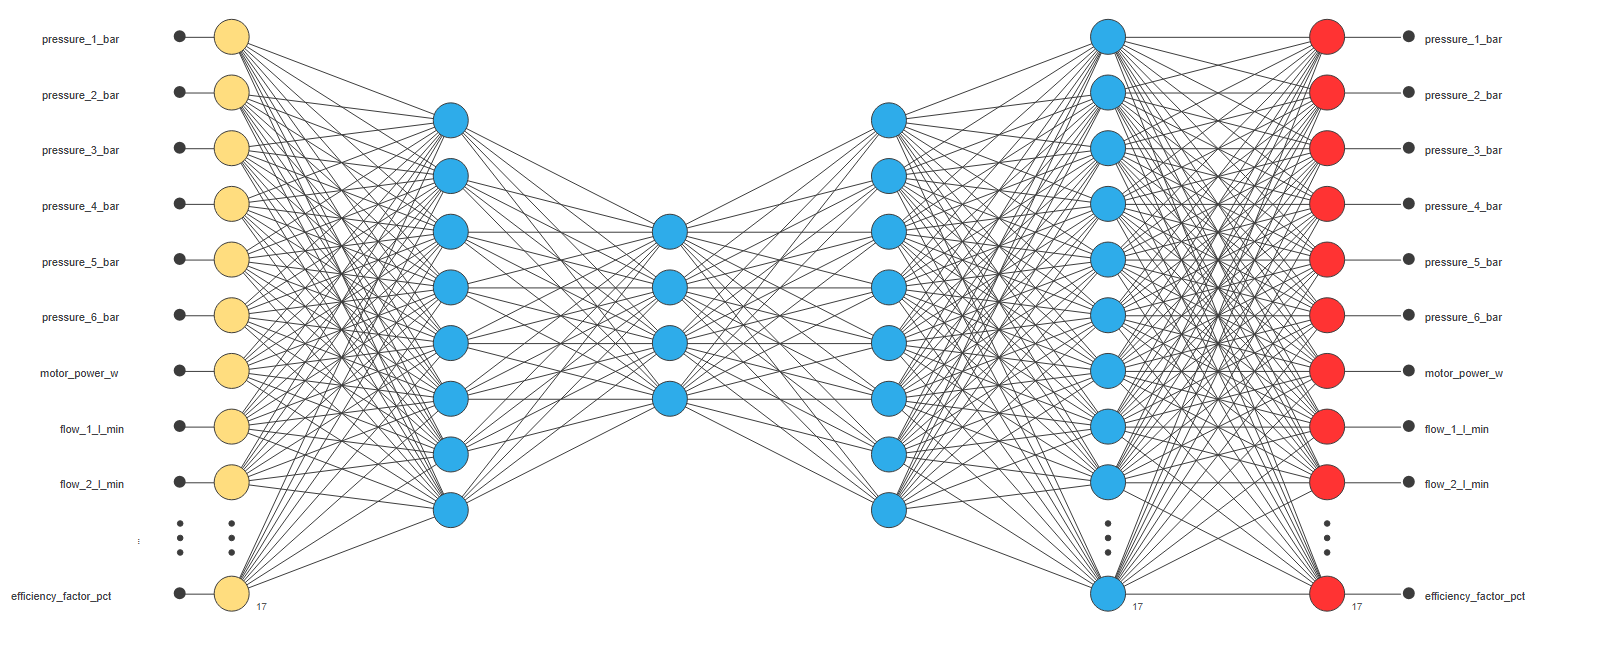
The final autoencoder has 17 → 8 → 4 → 8 → 17 units and 373 trainable parameters. Inputs are standardized with the training means and standard deviations; the three hidden stages use ReLU and the reconstruction output is linear before values are returned to their original units. The pump-leakage label is used only for evaluation and never enters the reconstruction path.
The four-unit bottleneck forces the network to represent the normal operating pattern compactly. A high error indicates poor reconstruction of the complete sensor pattern; it does not identify a physical root cause by itself.
4. Training strategy
The final saved model minimizes mean absolute error with Adam (learning rate 0.001, batch size 32) and no regularization. It reaches the configured maximum of 1,000 epochs with standardized training error 0.107 and validation error 0.119 on the normal-only subsets. The close final values do not establish robustness across random initializations; they show only that this run fits the two stored normal blocks similarly.
5. Model selection
No executed architecture-selection comparison is saved. The 17 → 8 → 4 → 8 → 17 network is therefore the evaluated configuration, not a demonstrated optimum. A professional study would compare bottleneck sizes and random seeds on a separate normal validation period, freeze the selected model, and only then evaluate leakage cycles.
Threshold sensitivity
The automatic rule uses mean training error plus one standard deviation. The candidate table comes from the final Neural Designer threshold task. Validation-normal and test columns are consequences of each rule; test performance must not be used to select a threshold and then reported as independent evidence.
| Candidate rule | Threshold | Validation normal flagged | Test cycles flagged | Leak recall | Precision |
|---|---|---|---|---|---|
| Training P95 | 1.142 | 5.33% | 48.3% | 59.2% | 98.1% |
| Mean + 1 SD (reported) | 2.389 | 3.28% | 20.5% | 25.0% | 97.6% |
| Training P99 | 3.048 | 1.23% | 18.8% | 22.9% | 97.4% |
| Mean + 2 SD | 4.212 | 0.82% | 18.8% | 22.9% | 97.4% |
6. Testing analysis
The final anomaly score is mean absolute reconstruction error in the variables’ original units. Across 732 normal training cycles its mean is approximately 0.567 and its standard deviation is approximately 1.823, giving the exported automatic mean-plus-one-standard-deviation threshold 2.38958. The model flags 252 of 1,229 test cycles.
The score still ranks leakage-labelled cycles reasonably well (ROC AUC 0.902), but the chosen operating point recovers only 25.0% of them. This distinction matters: ROC AUC describes ranking across all thresholds, while the confusion matrix describes one specific review threshold.
| Test measure | Value | Count or context |
|---|---|---|
| ROC AUC | 0.902 | Score ranking across 1,229 packaged test cycles |
| Leak recall | 25.0% | 246 of 984 weak or severe leakage cycles |
| No-leak specificity | 97.6% | 239 of 245 no-leak cycles |
| Precision on this enriched subset | 97.6% | 246 of 252 flagged cycles; prevalence-dependent |
| F1 score | 39.8% | At exported threshold 2.38958 |
| Accuracy | 39.5% | 485 of 1,229 test cycles |
| Official pump-leakage state | Flagged | Not flagged | Detection rate |
|---|---|---|---|
| No leak (class 0) | 6 | 239 | 2.4% flagged |
| Weak leakage (class 1) | 105 | 387 | 21.3% detected |
| Severe leakage (class 2) | 141 | 351 | 28.7% detected |
7. Model deployment
In Neural Designer, run Perform training to reproduce the learning curve, Calculate anomaly threshold to inspect the training and testing score distributions, Calculate anomaly ROC curve to assess ranking performance and Calculate anomaly detection tests to recover the operating-point metrics. For a selected cycle, Plot sample reconstruction reports both standardized input-versus-reconstruction bars and per-variable reconstruction errors, which is the most useful diagnostic view for signals with different units.
- AcquirePreserve asset, cycle, timestamp, duty point and sensor-health metadata.
- TransformReproduce the same 60-second aggregation, variable names, units and ordering.
- ScoreStore the versioned reconstruction error and per-variable residuals.
- GateApply a threshold and persistence rule calibrated to the acceptable inspection workload.
- ConfirmReview trends and contributing signals with hydraulic diagnostics before maintenance action.
Export anomaly detector is appropriate only after validating that complete chain on separate equipment or test campaigns.
8. Scope and limitations
This is an internal benchmark on one laboratory test rig. The split does not isolate a different rig, asset, campaign or duty profile, and the test subset contains far more leakage cycles than a typical monitoring stream. Cycle means discard within-cycle dynamics. The binary target also combines weak and severe leakage; at the reported threshold the detector recovers only 21.3% of weak-leak and 28.7% of severe-leak cycles.
The reconstruction score is unit-sensitive and is not a leakage magnitude, remaining-useful-life estimate or universal alarm limit. Before field use, validate independent assets and operating regimes, retain the original severity labels, calibrate threshold and persistence on realistic normal operation, quantify false alerts per asset-hour, evaluate detection lead time, test sensor failures and drift, and define an engineering confirmation procedure. The detector must not command an automatic shutdown or replace hydraulic inspection.
References
Project evidence: the current saved hydraulic.nd project, hydraulic_anomaly_detection.csv, native Neural Designer tasks executed on that saved model and a row-level comparison against the official sensor matrices and profile.txt. Primary source: Helwig, Pignanelli and Schütze, Condition Monitoring of Hydraulic Systems, UCI Machine Learning Repository, DOI 10.24432/C5CW21. See Neural Designer model types.