Classify recorded primary tumor sites
Use 17 recorded patient characteristics and metastatic-site indicators to classify the primary tumor site in the UCI Primary Tumor dataset. The supplied project selects an eight-neuron hidden layer and evaluates 67 internally held-out records.
1. Clinical question and intended use
This retrospective biomedical benchmark studies associations between patient descriptors, observed metastatic locations and a recorded tumor-site label. It supports reproducible research; it is not prospective metastasis prediction or a diagnostic instrument.
Recorded site labels
Model the observed primary-site annotation.
Selection chronology
Compare the initial and selected network architectures.
Rare-site review
Inspect per-site denominators and missed cases.
2. Cohort, measurements and endpoint
UCI Primary Tumor contains 339 records from the Ljubljana Oncology Institute. The adapted CSV decodes source categories. There are 21 observed target categories in this copy; the upstream coding scheme lists 22 possible sites. Question-mark values are retained as explicit categories in several inputs, rather than interpreted as measured clinical findings.
Source: Primary Tumor. Dataset license: CC-BY-4.0. The downloadable ZIP includes the adapted data and attribution notices.
| Dataset measure | Saved value |
|---|---|
| Analysis unit | patient record |
| Records | 339 |
| Raw variables | 18 |
| Encoded model inputs | 31 |
| Model outputs | 21 |
| Training roles | 205 |
| Validation / selection roles | 67 |
| Testing roles | 67 |
| Unused roles | 0 |
| Field | Role | Type | Categories |
|---|---|---|---|
| class | Target | Categorical | bladder, breast, cervix_uteri, colon, corpus_uteri, duodenum_and_small_intestine, esophagus, gallbladder, head_and_neck, kidney, liver, lung, ovary, pancreas, prostate, rectum, salivary_glands, stomach, testis, thyroid, vagina |
| age | Input | Categorical | 30_to_59, 60_or_over, under_30 |
| sex | Input | Categorical | ?, female, male |
| histologic_type | Input | Categorical | ?, adeno, anaplastic, epidermoid |
| degree_of_differentiation | Input | Categorical | ?, fairly, poorly, well |
| bone | Input | Binary | no, yes |
| bone_marrow | Input | Binary | no, yes |
| lung | Input | Binary | no, yes |
| pleura | Input | Binary | no, yes |
| peritoneum | Input | Binary | no, yes |
| liver | Input | Binary | no, yes |
| brain | Input | Binary | no, yes |
| skin | Input | Categorical | ?, no, yes |
| neck | Input | Binary | no, yes |
| supraclavicular | Input | Binary | no, yes |
| axillar | Input | Categorical | ?, no, yes |
| mediastinum | Input | Binary | no, yes |
| abdominal | Input | Binary | no, yes |
Target class distribution table
| Measure | Samples | Share (%) |
|---|---|---|
| bladder | 2 | 0.59 |
| breast | 24 | 7.08 |
| cervix_uteri | 2 | 0.59 |
| colon | 14 | 4.13 |
| corpus_uteri | 6 | 1.77 |
| duodenum_and_small_intestine | 1 | 0.29 |
| esophagus | 9 | 2.65 |
| gallbladder | 16 | 4.72 |
| head_and_neck | 20 | 5.90 |
| kidney | 24 | 7.08 |
| liver | 7 | 2.06 |
| lung | 84 | 24.78 |
| ovary | 29 | 8.55 |
| pancreas | 28 | 8.26 |
| prostate | 10 | 2.95 |
| rectum | 6 | 1.77 |
| salivary_glands | 2 | 0.59 |
| stomach | 39 | 11.50 |
| testis | 1 | 0.29 |
| thyroid | 14 | 4.13 |
| vagina | 1 | 0.29 |
3. Model
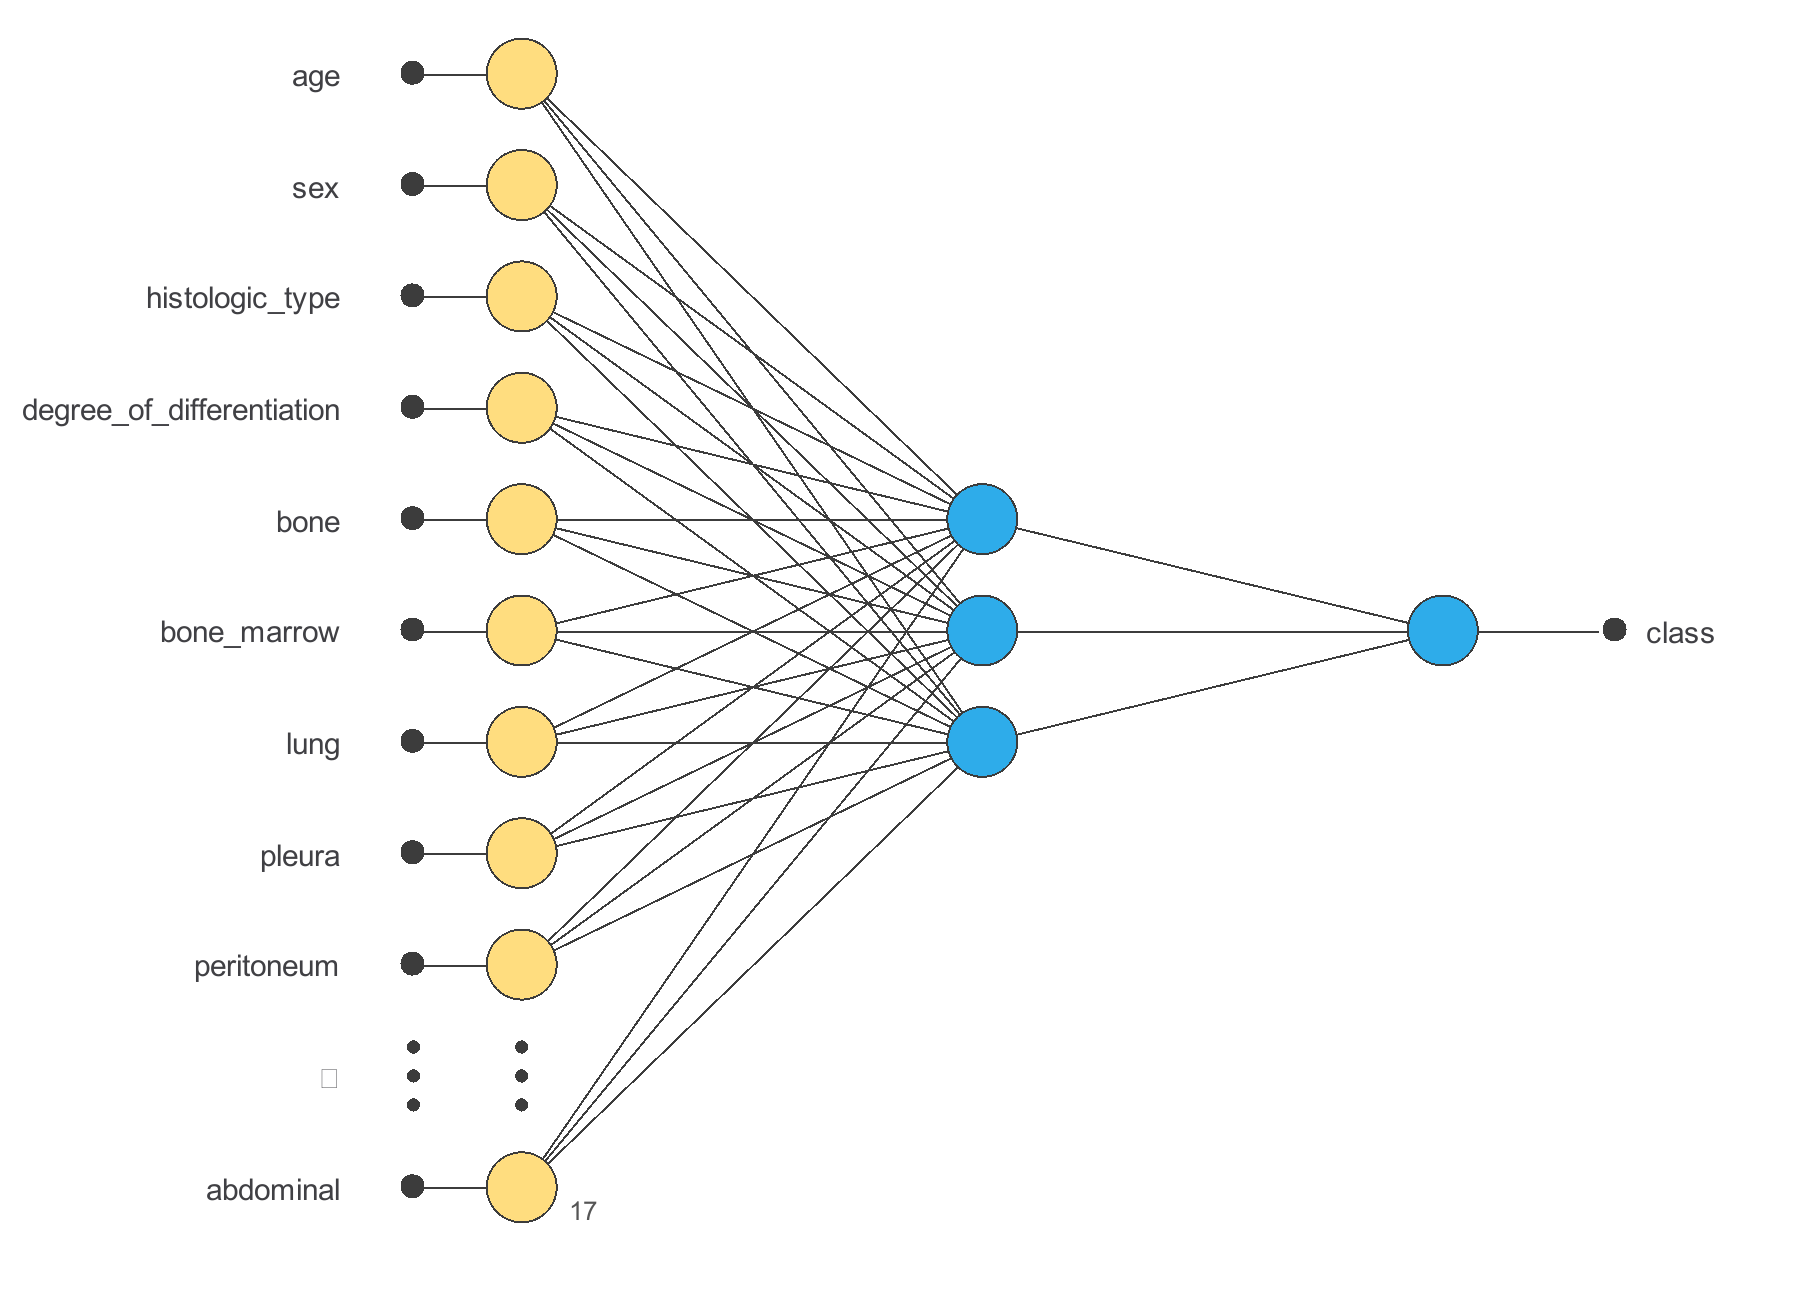
The model has 31 encoded inputs and 21 outputs. The initial architecture is shown below; the selected architecture follows the selection experiment. Native diagrams group categorical features by source field, so their 17 input nodes and one target node represent 31 encoded inputs and 21 outputs.
| Layer | Input shape | Output shape | Activation |
|---|---|---|---|
| Scaling | 31 | 31 | |
| Dense | 31 | 3 | Tanh |
| Dense | 3 | 21 | Sigmoid |
Output values are uncalibrated model scores. Use the output encodings and decision rule documented with this project; do not assume independent sigmoid scores sum to one.
4. Training strategy
The saved training configuration uses QuasiNewton with CrossEntropy.
No separate completed training task is stored in this report. The neuron-selection experiment below contains the saved fitting results.
5. Model selection and baseline
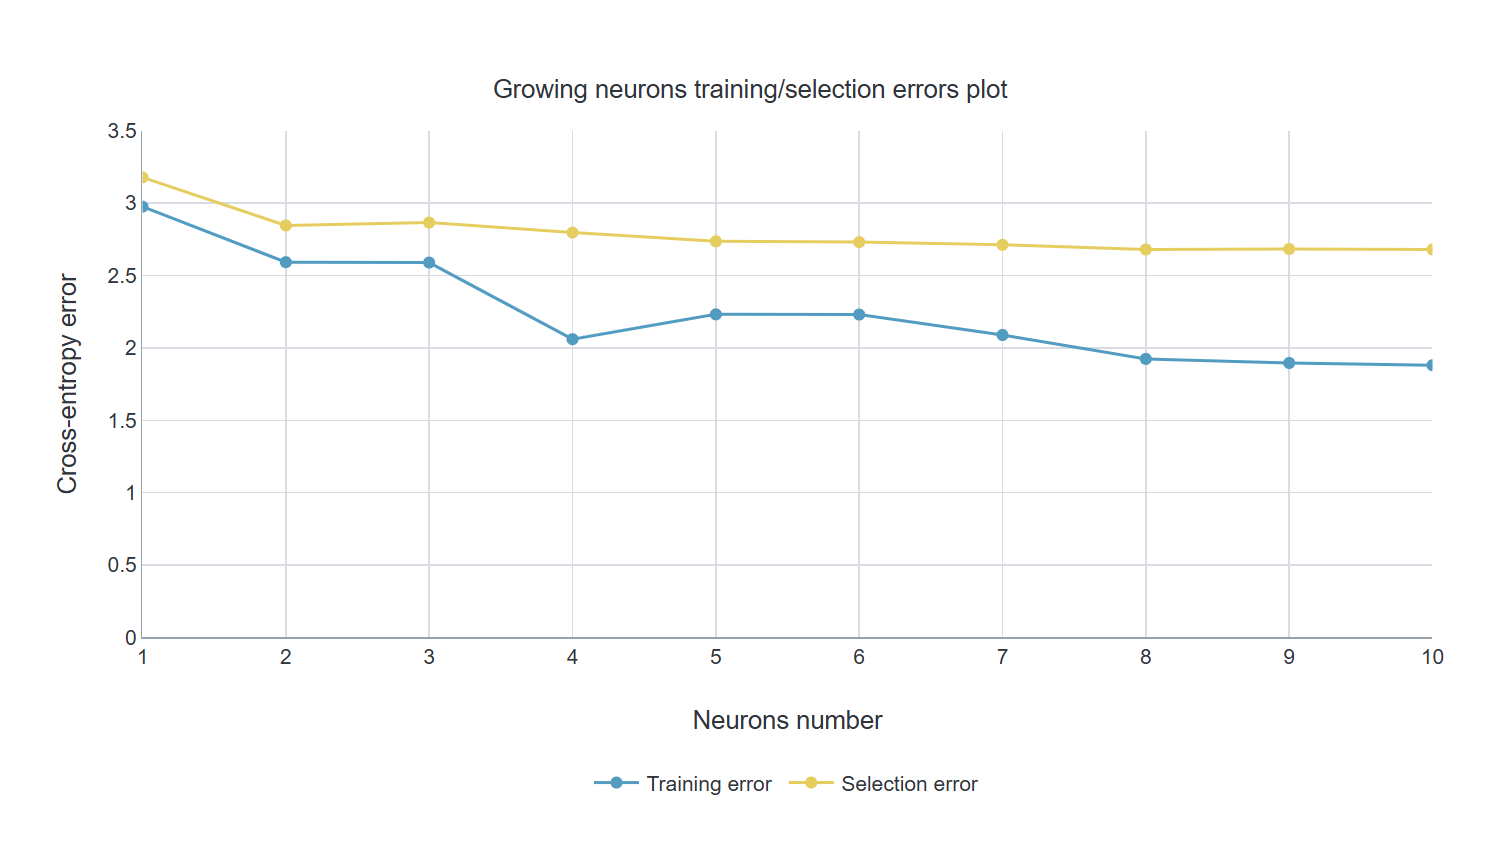
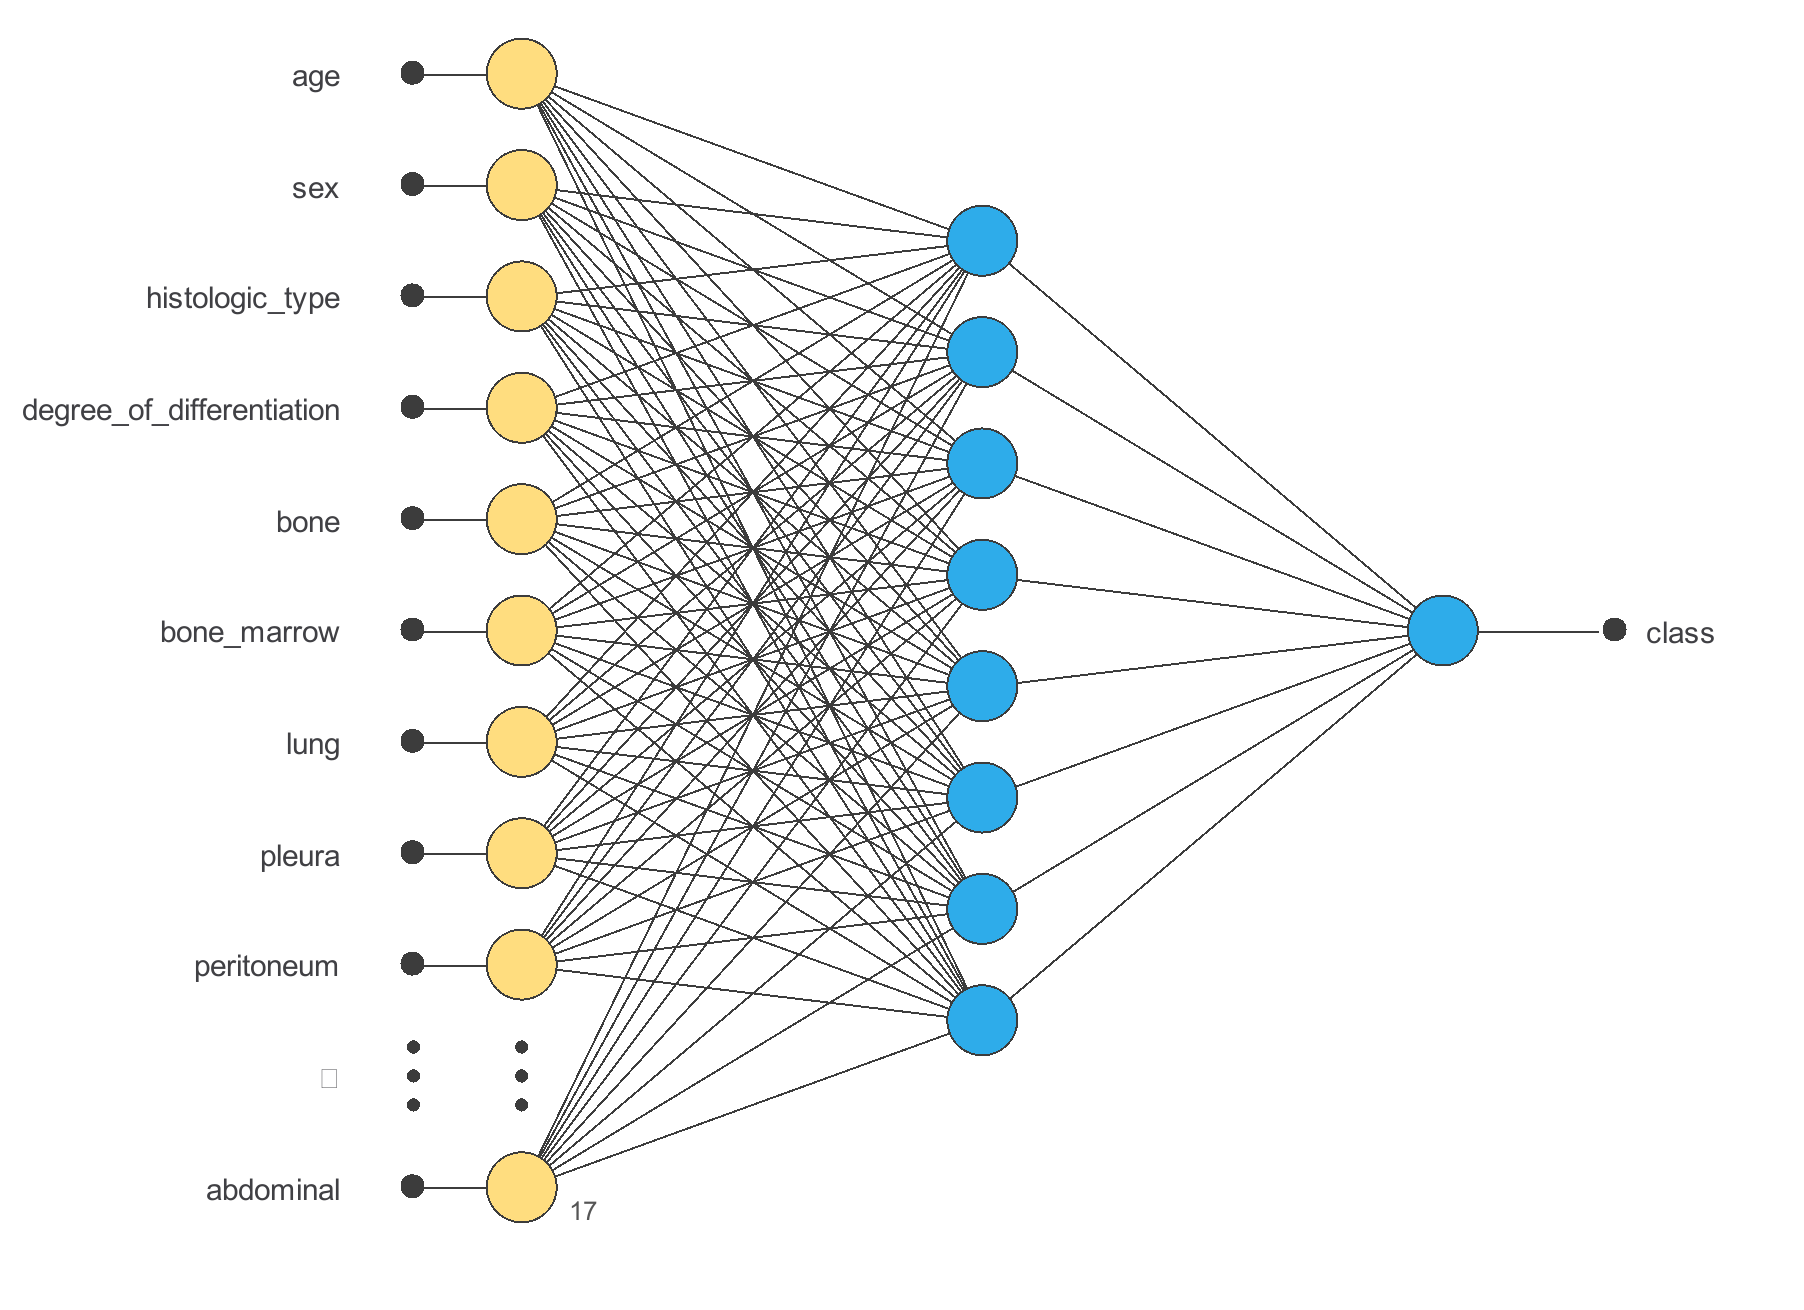
The saved growing-neurons experiment selected eight hidden neurons. The initial network has three hidden neurons; the selected network is shown after the selection results, and precedes testing.
Growing neurons results
| Measure | Value |
|---|---|
| Optimal neurons number | 8 |
| Optimum training error | 1.924 |
| Optimum selection error | 2.679 |
| Epochs number | 10 |
| Stopping criterion | Maximum neurons reached |
| Elapsed time | 00:00:01 |
| Selected layer | Input shape | Output shape | Activation |
|---|---|---|---|
| Scaling | 31 | 31 | |
| Dense | 31 | 8 | Tanh |
| Dense | 8 | 21 | Sigmoid |
On this test subset a majority-class baseline would correctly classify 98.51% of the records. This baseline does not detect both classes and is not an optimized model.
6. Clinical validation
The figures and tables below refer to the current project’s saved testing analysis. The subset uses testing role 2; it contains 67 source records.
The native report provides one-versus-rest confusion counts at threshold 0.5 and a separate multiple-classification summary. Some test classes have zero support. A single clinical sensitivity, specificity, precision or ROC AUC is not asserted across the 21 sites; the per-site counts define the evaluation.
These operating-point metrics are calculated from the saved confusion counts at threshold 0.5. They apply to bladder; the remaining outputs have separate one-versus-rest tables.
Confusion table: bladder
| Measure | Predicted positive | Predicted negative | Total |
|---|---|---|---|
| Actual positive | 0 (0.0%) | 1 (1.5%) | 1 (1.5%) |
| Actual negative | 0 (0.0%) | 66 (98.5%) | 66 (98.5%) |
| Total | 0 (0.0%) | 67 (100.0%) | 67 (100.0%) |
Inspect every output confusion table
Confusion table: breast
| Measure | Predicted positive | Predicted negative | Total |
|---|---|---|---|
| Actual positive | 3 (4.5%) | 1 (1.5%) | 4 (6.0%) |
| Actual negative | 2 (3.0%) | 61 (91.0%) | 63 (94.0%) |
| Total | 5 (7.5%) | 62 (92.5%) | 67 (100.0%) |
Confusion table: cervix_uteri
| Measure | Predicted positive | Predicted negative | Total |
|---|---|---|---|
| Actual positive | 0 (0.0%) | 0 (0.0%) | 0 (0.0%) |
| Actual negative | 0 (0.0%) | 67 (100.0%) | 67 (100.0%) |
| Total | 0 (0.0%) | 67 (100.0%) | 67 (100.0%) |
Confusion table: colon
| Measure | Predicted positive | Predicted negative | Total |
|---|---|---|---|
| Actual positive | 0 (0.0%) | 3 (4.5%) | 3 (4.5%) |
| Actual negative | 0 (0.0%) | 64 (95.5%) | 64 (95.5%) |
| Total | 0 (0.0%) | 67 (100.0%) | 67 (100.0%) |
Confusion table: corpus_uteri
| Measure | Predicted positive | Predicted negative | Total |
|---|---|---|---|
| Actual positive | 0 (0.0%) | 0 (0.0%) | 0 (0.0%) |
| Actual negative | 0 (0.0%) | 67 (100.0%) | 67 (100.0%) |
| Total | 0 (0.0%) | 67 (100.0%) | 67 (100.0%) |
Confusion table: duodenum_and_small_intestine
| Measure | Predicted positive | Predicted negative | Total |
|---|---|---|---|
| Actual positive | 0 (0.0%) | 0 (0.0%) | 0 (0.0%) |
| Actual negative | 0 (0.0%) | 67 (100.0%) | 67 (100.0%) |
| Total | 0 (0.0%) | 67 (100.0%) | 67 (100.0%) |
Confusion table: esophagus
| Measure | Predicted positive | Predicted negative | Total |
|---|---|---|---|
| Actual positive | 0 (0.0%) | 0 (0.0%) | 0 (0.0%) |
| Actual negative | 0 (0.0%) | 67 (100.0%) | 67 (100.0%) |
| Total | 0 (0.0%) | 67 (100.0%) | 67 (100.0%) |
Confusion table: gallbladder
| Measure | Predicted positive | Predicted negative | Total |
|---|---|---|---|
| Actual positive | 0 (0.0%) | 6 (9.0%) | 6 (9.0%) |
| Actual negative | 0 (0.0%) | 61 (91.0%) | 61 (91.0%) |
| Total | 0 (0.0%) | 67 (100.0%) | 67 (100.0%) |
Confusion table: head_and_neck
| Measure | Predicted positive | Predicted negative | Total |
|---|---|---|---|
| Actual positive | 3 (4.5%) | 0 (0.0%) | 3 (4.5%) |
| Actual negative | 0 (0.0%) | 64 (95.5%) | 64 (95.5%) |
| Total | 3 (4.5%) | 64 (95.5%) | 67 (100.0%) |
Confusion table: kidney
| Measure | Predicted positive | Predicted negative | Total |
|---|---|---|---|
| Actual positive | 1 (1.5%) | 3 (4.5%) | 4 (6.0%) |
| Actual negative | 0 (0.0%) | 63 (94.0%) | 63 (94.0%) |
| Total | 1 (1.5%) | 66 (98.5%) | 67 (100.0%) |
Confusion table: liver
| Measure | Predicted positive | Predicted negative | Total |
|---|---|---|---|
| Actual positive | 0 (0.0%) | 0 (0.0%) | 0 (0.0%) |
| Actual negative | 0 (0.0%) | 67 (100.0%) | 67 (100.0%) |
| Total | 0 (0.0%) | 67 (100.0%) | 67 (100.0%) |
Confusion table: lung
| Measure | Predicted positive | Predicted negative | Total |
|---|---|---|---|
| Actual positive | 13 (19.4%) | 9 (13.4%) | 22 (32.8%) |
| Actual negative | 5 (7.5%) | 40 (59.7%) | 45 (67.2%) |
| Total | 18 (26.9%) | 49 (73.1%) | 67 (100.0%) |
Confusion table: ovary
| Measure | Predicted positive | Predicted negative | Total |
|---|---|---|---|
| Actual positive | 3 (4.5%) | 2 (3.0%) | 5 (7.5%) |
| Actual negative | 0 (0.0%) | 62 (92.5%) | 62 (92.5%) |
| Total | 3 (4.5%) | 64 (95.5%) | 67 (100.0%) |
Confusion table: pancreas
| Measure | Predicted positive | Predicted negative | Total |
|---|---|---|---|
| Actual positive | 0 (0.0%) | 6 (9.0%) | 6 (9.0%) |
| Actual negative | 0 (0.0%) | 61 (91.0%) | 61 (91.0%) |
| Total | 0 (0.0%) | 67 (100.0%) | 67 (100.0%) |
Confusion table: prostate
| Measure | Predicted positive | Predicted negative | Total |
|---|---|---|---|
| Actual positive | 0 (0.0%) | 0 (0.0%) | 0 (0.0%) |
| Actual negative | 0 (0.0%) | 67 (100.0%) | 67 (100.0%) |
| Total | 0 (0.0%) | 67 (100.0%) | 67 (100.0%) |
Confusion table: rectum
| Measure | Predicted positive | Predicted negative | Total |
|---|---|---|---|
| Actual positive | 0 (0.0%) | 3 (4.5%) | 3 (4.5%) |
| Actual negative | 0 (0.0%) | 64 (95.5%) | 64 (95.5%) |
| Total | 0 (0.0%) | 67 (100.0%) | 67 (100.0%) |
Confusion table: salivary_glands
| Measure | Predicted positive | Predicted negative | Total |
|---|---|---|---|
| Actual positive | 0 (0.0%) | 1 (1.5%) | 1 (1.5%) |
| Actual negative | 0 (0.0%) | 66 (98.5%) | 66 (98.5%) |
| Total | 0 (0.0%) | 67 (100.0%) | 67 (100.0%) |
Confusion table: stomach
| Measure | Predicted positive | Predicted negative | Total |
|---|---|---|---|
| Actual positive | 0 (0.0%) | 7 (10.4%) | 7 (10.4%) |
| Actual negative | 1 (1.5%) | 59 (88.1%) | 60 (89.6%) |
| Total | 1 (1.5%) | 66 (98.5%) | 67 (100.0%) |
Confusion table: testis
| Measure | Predicted positive | Predicted negative | Total |
|---|---|---|---|
| Actual positive | 0 (0.0%) | 0 (0.0%) | 0 (0.0%) |
| Actual negative | 0 (0.0%) | 67 (100.0%) | 67 (100.0%) |
| Total | 0 (0.0%) | 67 (100.0%) | 67 (100.0%) |
Confusion table: thyroid
| Measure | Predicted positive | Predicted negative | Total |
|---|---|---|---|
| Actual positive | 0 (0.0%) | 2 (3.0%) | 2 (3.0%) |
| Actual negative | 0 (0.0%) | 65 (97.0%) | 65 (97.0%) |
| Total | 0 (0.0%) | 67 (100.0%) | 67 (100.0%) |
Confusion table: vagina
| Measure | Predicted positive | Predicted negative | Total |
|---|---|---|---|
| Actual positive | 0 (0.0%) | 0 (0.0%) | 0 (0.0%) |
| Actual negative | 0 (0.0%) | 67 (100.0%) | 67 (100.0%) |
| Total | 0 (0.0%) | 67 (100.0%) | 67 (100.0%) |
| Test measure | Value |
|---|---|
| Testing records | 67 |
| Positive cases | 1 |
| Positive prevalence | 1.49% |
| Accuracy | 98.51% |
| Sensitivity / recall | 0.00% |
| Specificity | 100.00% |
| Precision / PPV | Undefined (zero denominator) |
| F1 score | 0.000 |
Multiple classification tests
| Measure | Precision | Recall | F1 score |
|---|---|---|---|
| bladder | 0.000 | 0.000 | 0.000 |
| breast | 0.600 | 0.750 | 0.667 |
| cervix_uteri | 0.000 | 0.000 | 0.000 |
| colon | 0.000 | 0.000 | 0.000 |
| corpus_uteri | 0.000 | 0.000 | 0.000 |
| duodenum_and_small_intestine | 0.000 | 0.000 | 0.000 |
| esophagus | 0.000 | 0.000 | 0.000 |
| gallbladder | 0.600 | 0.500 | 0.545 |
| head_and_neck | 1.000 | 1.000 | 1.000 |
| kidney | 0.667 | 0.500 | 0.571 |
| liver | 0.000 | 0.000 | 0.000 |
| lung | 0.739 | 0.773 | 0.756 |
| ovary | 0.364 | 0.800 | 0.500 |
| pancreas | 0.333 | 0.167 | 0.222 |
| prostate | 0.000 | 0.000 | 0.000 |
| rectum | 0.000 | 0.000 | 0.000 |
| salivary_glands | 0.000 | 0.000 | 0.000 |
| stomach | 0.167 | 0.286 | 0.211 |
| testis | 0.000 | 0.000 | 0.000 |
| thyroid | 0.000 | 0.000 | 0.000 |
| vagina | 0.000 | 0.000 | 0.000 |
| Macro average | 0.213 | 0.227 | 0.213 |
| Weighted average | 0.491 | 0.522 | 0.495 |
7. Workflow and reproducibility
Open the downloaded project in Neural Designer, inspect the dataset roles and preprocessing, then review the saved task report. Use the same input schema and category order when calculating outputs. The ZIP contains the exact current .nd, its source data and the applicable dataset notices.
Research workflow: eligible record or image → measurement and schema checks → model score → expert review → confirmatory clinical method where appropriate. No model output should be used as an autonomous diagnosis or treatment instruction.
8. Safety, generalizability and governance
The 67-row test subset leaves some tumor sites absent or represented by very few records. The saved network uses separate sigmoid outputs; its one-versus-rest tables must not be mistaken for a normalized probability distribution. No external validation or calibrated clinical probabilities are established.
References
- Primary Tumor. M. Zwitter; M. Soklic. 10.24432/C5WK5Q
- Dataset terms: Creative Commons Attribution 4.0 International. Full attribution and transformations are included in
LICENSES/DATASET-LICENSE.txt. - Current Neural Designer project and saved task report, snapshot 6 October 2026.