Audit a five-class HCV laboratory-record model beyond headline accuracy
This reproducible Neural Designer example maps age, sex and ten laboratory measurements to the five source labels in the 615-record UCI HCV data set. The fixed model classifies 115 of 123 internally held-out records correctly, but 112 test records carry the majority blood-donor/none label. Macro sensitivity is 35.0%, and only 3 of 11 records from the four non-none categories are classified correctly. The artifact is suitable for education and model audit, not diagnosis or fibrosis staging.
1. Clinical question and intended use
The defensible purpose of this artifact is retrospective machine-learning education, software verification and audit of a highly imbalanced multiclass benchmark. It reproduces the labels in a historical public table; it does not establish the presence, cause or stage of liver disease in a new patient.
The intended users are clinical data scientists, laboratory-medicine researchers, biostatisticians and model-governance teams. The supported action is to inspect preprocessing, class imbalance, optimization and class-level test behaviour before designing a stronger study.
Expose imbalance
Compare overall accuracy with macro sensitivity and the 91.1% majority-class baseline.
Trace the artifact
Reproduce the stored split, mean imputation, direct softmax model and exact exported scores.
Define the evidence gap
Separate internal record-level performance from calibration, clinical validity and external transportability.
2. Cohort, measurements and endpoint
The analysis uses the UCI HCV data set (DOI 10.24432/C5D612), accessed 13 August 2026 and distributed under CC BY 4.0. UCI describes each instance as a patient and the table as laboratory values from blood donors and hepatitis C patients. The processed CSV used here contains 615 records, 12 inputs and one five-class endpoint.
| Source category | Processed label | Records | Share |
|---|---|---|---|
| 3 = Cirrhosis | cirrhosis | 30 | 4.9% |
| 2 = Fibrosis | fibrosis | 21 | 3.4% |
| 1 = Hepatitis | hepatitis | 24 | 3.9% |
| 0 = Blood donor | none | 533 | 86.7% |
| 0s = Suspect blood donor | suspect_disease | 7 | 1.1% |
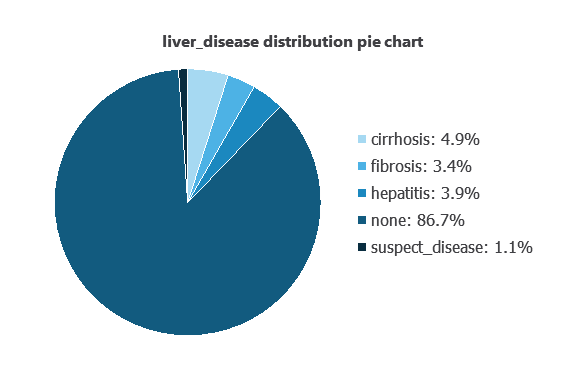
none maps to the source blood-donor category and must not be interpreted as a clinically verified absence of all liver disease.The UCI record identifies age in years and sex as f/m. The remaining inputs are albumin, alkaline phosphatase, alanine aminotransferase, aspartate aminotransferase, bilirubin, cholinesterase, cholesterol, creatinine (named creatinina in the processed file), gamma-glutamyl transferase and total protein. The downloadable UCI metadata does not specify measurement units for these laboratory fields, so this page does not invent units or clinical reference ranges.
| Subset | Rows | Cirrhosis | Fibrosis | Hepatitis | None | Suspect |
|---|---|---|---|---|---|---|
| Training | 369 | 16 | 16 | 16 | 317 | 4 |
| Selection | 123 | 10 | 1 | 7 | 104 | 1 |
| Testing | 123 | 4 | 4 | 1 | 112 | 2 |
The stored project uses a random 60/20/20 row split. The audit found no duplicate complete rows or duplicate input vectors. It found 31 missing values in 26 records: albumin 1, alkaline phosphatase 18, alanine aminotransferase 1, cholesterol 10 and protein 1. The project uses mean replacement.
3. Model
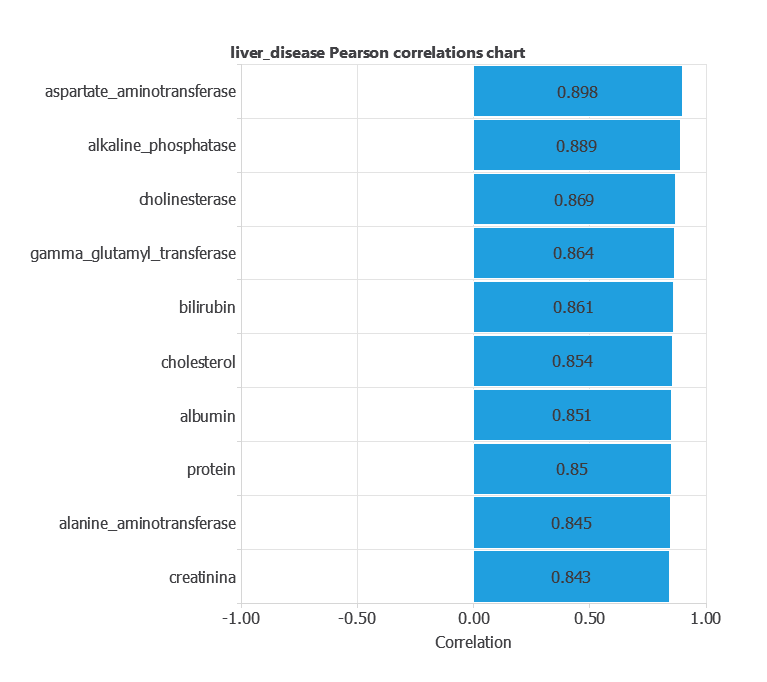
Eleven numeric inputs use mean-and-standard-deviation scaling; binary sex uses minimum-maximum scaling. The scaled values connect directly to five softmax outputs, with no hidden layer. The model therefore behaves as a multinomial logistic classifier and contains 65 trainable coefficients: 60 input weights and five biases.
argmax).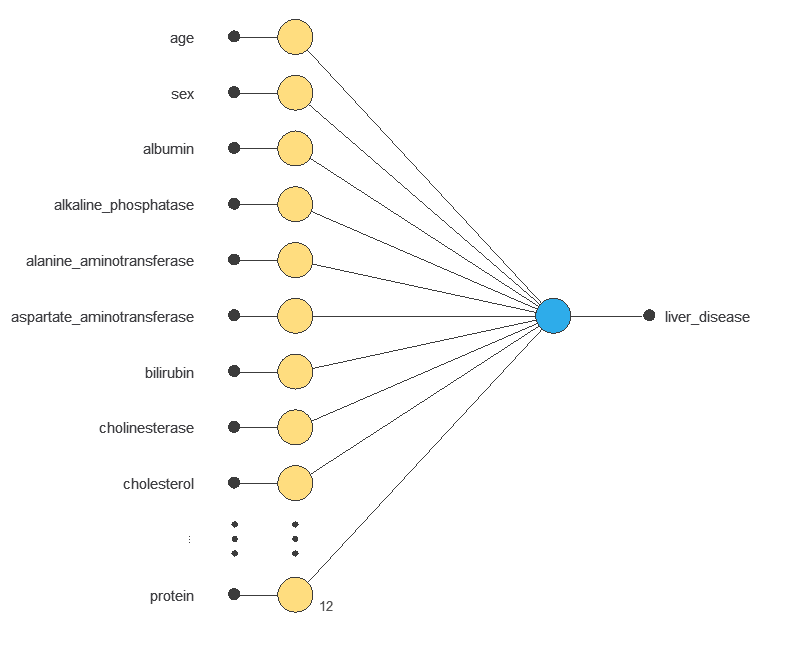
4. Training strategy
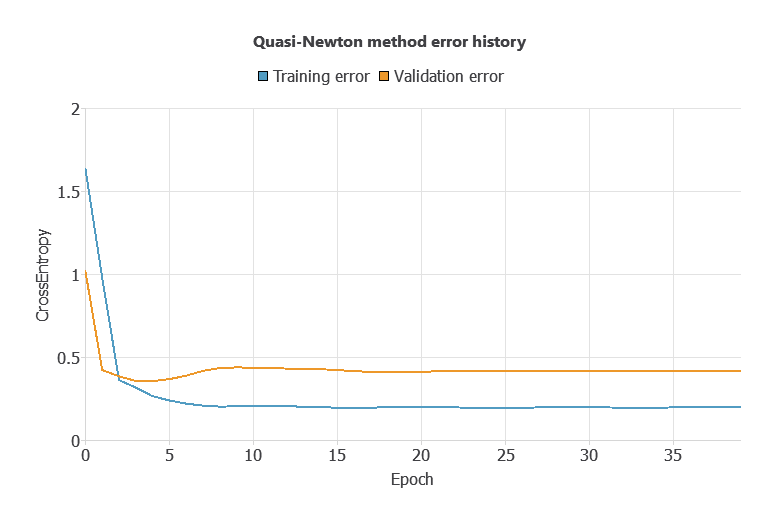
The stored project minimizes multiclass cross-entropy with L2 regularization weight 0.01 and the quasi-Newton optimizer. It stops on minimum loss decrease after 40 stored epochs (0–39); no class weighting or resampling is recorded.
Training cross-entropy falls from 1.6449 to 0.1969. Selection cross-entropy falls from 1.0226 to approximately 0.356 at epoch 4, then rises and ends at 0.4166. That divergence is evidence of overfitting risk; the final export must not be described as a selection-optimal checkpoint.
5. Model selection and baseline
No neuron selection, feature selection or architecture selection was performed. The direct 12-to-5 classifier is both the initial and final model. The selection subset monitors optimization but was not used to compare documented candidate architectures.
| Testing reference | Accuracy | Macro sensitivity | Correct non-none labels |
|---|---|---|---|
Always predict none | 91.1% (112/123) | 20.0% | 0/11 |
| Fixed softmax model | 93.5% (115/123) | 35.0% | 3/11 |
The model improves accuracy by only 2.4 percentage points over the transparent majority baseline. Macro sensitivity improves by 15 points but remains low, which is more informative than the headline accuracy for this imbalanced five-class task.
6. Clinical validation
The final exported model was recomputed against the 123 records marked as testing in the project, reproducing the supplied confusion table exactly. These records were held out from coefficient fitting, but not from preprocessing statistics. Test prevalence is highly skewed: 112 none records (91.1%) versus only 11 records across the four other categories.
Calibration, multiclass ROC AUC and PR AUC were not evaluated or supplied. With only one hepatitis record, two suspect records and four each for fibrosis and cirrhosis, class-specific estimates have very wide uncertainty and cannot establish diagnostic performance.
Decision rule and confusion matrix
No binary or class-specific decision threshold was selected. The reported operating point assigns the label with the largest of the five softmax scores (argmax); no threshold was optimized on the test subset.
| Actual / predicted | Cirrhosis | Fibrosis | Hepatitis | None | Suspect | Total |
|---|---|---|---|---|---|---|
| Cirrhosis | 2 | 1 | 0 | 1 | 0 | 4 |
| Fibrosis | 0 | 1 | 0 | 3 | 0 | 4 |
| Hepatitis | 0 | 0 | 0 | 1 | 0 | 1 |
| None / blood donor | 0 | 0 | 0 | 112 | 0 | 112 |
| Suspect blood donor | 1 | 0 | 0 | 1 | 0 | 2 |
| Total | 3 | 2 | 0 | 118 | 0 | 123 |
| One-vs-rest label | Test prevalence | TP / FN / FP / TN | Sensitivity (95% Wilson CI) | Specificity | Observed precision / PPV |
|---|---|---|---|---|---|
| Cirrhosis | 4/123 (3.3%) | 2 / 2 / 1 / 118 | 50.0% (15.0–85.0) | 99.2% | 66.7% |
| Fibrosis | 4/123 (3.3%) | 1 / 3 / 1 / 118 | 25.0% (4.6–69.9) | 99.2% | 50.0% |
| Hepatitis | 1/123 (0.8%) | 0 / 1 / 0 / 122 | 0% (0–79.3) | 100% | Not estimable |
| None / blood donor | 112/123 (91.1%) | 112 / 0 / 6 / 5 | 100% (96.7–100) | 45.5% | 94.9% |
| Suspect blood donor | 2/123 (1.6%) | 0 / 2 / 0 / 121 | 0% (0–65.8) | 100% | Not estimable |
| Overall test summary | Value |
|---|---|
| Accuracy | 93.5% (115/123) |
| Macro sensitivity / balanced multiclass recall | 35.0% |
| Macro F1 | 0.376 |
| Exact classification among four non-none categories | 27.3% (3/11) |
7. Workflow and reproducibility
A responsible workflow for this artifact is a controlled research reproduction:
Use batch inference only with the supplied schema. Reject unknown categories, missing fields not covered by the documented mean-replacement path and measurements whose units or assay context cannot be matched. The exported model should not receive clinical samples because the required laboratory units and deployment domain are not specified.
Verified reference calculation
The supplied export was checked with the reference vector shown below. The values are source-label model scores; the largest score is none.
| Reference input | Value | Reference input | Value |
|---|---|---|---|
| age | 33 | sex | f |
| albumin | 44 | alkaline_phosphatase | 74 |
| alanine_aminotransferase | 50 | aspartate_aminotransferase | 52 |
| bilirubin | 8.5 | cholinesterase | 6.5 |
| cholesterol | 3.34 | creatinina | 73 |
| gamma_glutamyl_transferase | 45 | protein | 74 |
| Source label | Model score |
|---|---|
| Cirrhosis | 0.096775 |
| Fibrosis | 0.152749 |
| Hepatitis | 0.107191 |
| None / blood donor | 0.585309 |
| Suspect blood donor | 0.057976 |
The Python package contains the exact export, ordered input schema, reference vector and expected scores. The Neural Designer package contains the project and exact processed CSV, preserving the split and analysis chronology.
8. Safety, generalizability and governance
- Internal evidence only: there is no external, temporal or independent-site validation and no prospective workflow evaluation.
- Preprocessing leakage: scaling summaries match the complete table rather than the training subset, so the test partition is not an untouched estimate.
- Endpoint uncertainty: full label-ascertainment details for the 615-row UCI table are not documented well enough to claim a uniform clinical reference standard.
- Class imbalance: the test set contains only 11 non-none records, including one hepatitis and two suspect records; accuracy is therefore dominated by the blood-donor category.
- Calibration and thresholds: score calibration, decision-curve utility and clinically prespecified thresholds are absent.
- Measurement transfer: laboratory units, instruments, analytic ranges and pre-analytic handling are not fully specified for deployment. Unmatched samples are out of domain.
- Subgroups: age- and sex-stratified performance, missingness effects and clinically relevant subgroup robustness were not established.
- Human oversight: any future research study requires laboratory and specialist review, a confirmatory method, versioned preprocessing, audit logging and an abstention policy.
Evidence required before any clinical research transition
- Reconstruct label provenance and measurement units from primary source records.
- Predefine a clinically meaningful endpoint and comparator rather than inherit the five source categories uncritically.
- Use stratified, patient-level development with sufficient cases in every class and restore the best selection checkpoint.
- Evaluate calibration and prespecified operating points on a locked validation cohort.
- Perform external site and temporal validation with subgroup, missingness and assay-shift analyses.
- Assess prospective workflow impact under specialist oversight before considering regulated use.
References
- Lichtinghagen R, Klawonn F, Hoffmann G. HCV data. UCI Machine Learning Repository; 2020. DOI: 10.24432/C5D612.
- Hoffmann GF, Bietenbeck A, Lichtinghagen R, Klawonn F. Using machine learning techniques to generate laboratory diagnostic pathways—a case study. Journal of Laboratory and Precision Medicine. 2018;3:58.