Classify pancreatic-disease study specimens into three categories
This reproducible Neural Designer example treats diagnosis as one categorical endpoint: no pancreatic disease, benign hepatobiliary disease or pancreatic ductal adenocarcinoma (PDAC). The fixed softmax model correctly classifies 79 of 118 internally held-out specimens and detects 28 of 32 PDAC labels. It is a research benchmark, not a clinical diagnostic or screening system.
1. Clinical question and intended use
The model assigns each processed urine-specimen record to one of three mutually exclusive study labels. This is the coherent formulation for the supplied endpoint: a single categorical target and one three-score softmax output, rather than separate models for each category.
Its defensible use is reproducible biomarker-method research and software education. It may help investigators understand an end-to-end multiclass workflow, but it cannot determine whether an individual patient has pancreatic cancer.
One clinical question
Distinguish no pancreatic disease, benign hepatobiliary disease and PDAC in one categorical experiment.
Auditable cleaning
Remove variables with more than 45% missing values before fitting the model and document what remains.
Reproducible calculation
Inspect the exact split, encoded input contract, coefficients and three returned scores.
2. Cohort, measurements and endpoint
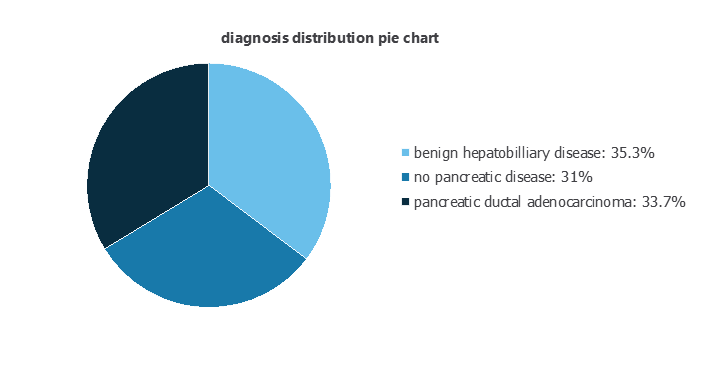
The data accompany a multicentre case-control biomarker study and contain 590 specimens: 183 with no pancreatic disease, 208 with benign hepatobiliary disease and 199 with PDAC. The project uses a reproducible random 60/20/20 row split: 354 training, 118 selection and 118 testing records.
Missing-data cleaning
Neural Designer’s Unuse missing variables task applies a 45% threshold before modelling. It removes the following columns:
| Variable | Missing rows | Missing rate | Decision |
|---|---|---|---|
stage | 391 | 66.3% | Unused |
benign_sample_diagnosis | 382 | 64.7% | Unused |
REG1A | 284 | 48.1% | Unused |
sample_id is also excluded because it is an identifier. plasma_CA19_9 remains available despite 240 missing values (40.7%), and the stored project replaces missing entries with the mean 654.003. The resulting model uses nine logical predictors, expanded to 12 numeric inputs after categorical encoding.
| Predictor | Role | Processing |
|---|---|---|
patient_cohort | Study provenance | Binary encoding |
sample_origin | Collection site | Four one-hot inputs |
age, sex | Demographics | Numeric/binary scaling |
plasma_CA19_9 | Blood biomarker | Mean imputation and scaling |
creatinine, LYVE1, REG1B, TFF1 | Urine measurements | Numeric scaling |
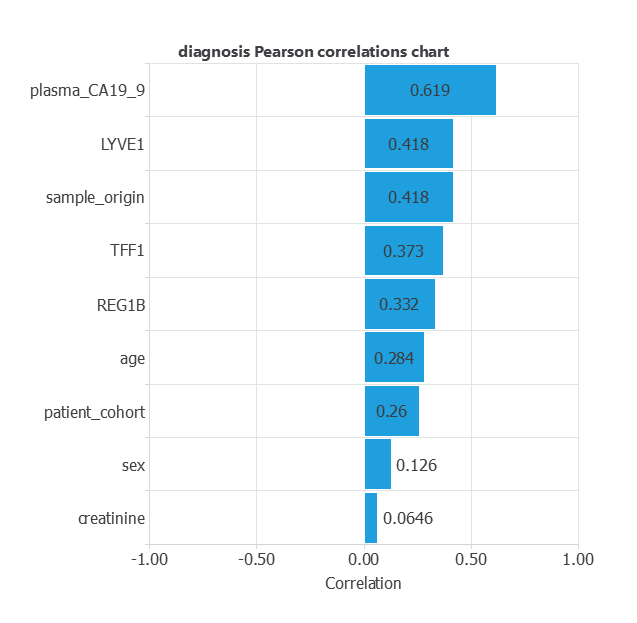
stage is available mainly for cancer cases and is outcome-adjacent, so excluding it also avoids an obvious shortcut. More subtly, cohort and collection site can encode centre effects. A professional validation should hold out complete sites or cohorts and test a biomarker-only specification.3. Model
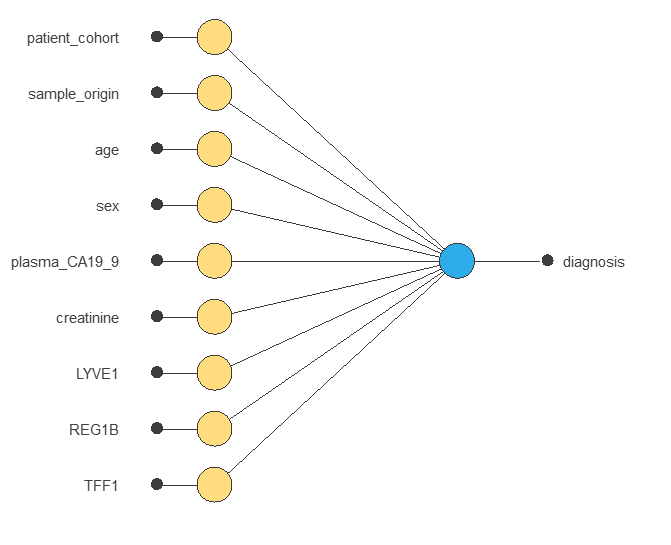
The fixed architecture has no hidden layer. Nine logical predictors become 12 numeric features after encoding cohort, origin and sex; a direct dense layer returns three softmax scores. With 36 weights and three biases, the model has 39 trainable parameters and is equivalent to multinomial logistic regression.
4. Training strategy
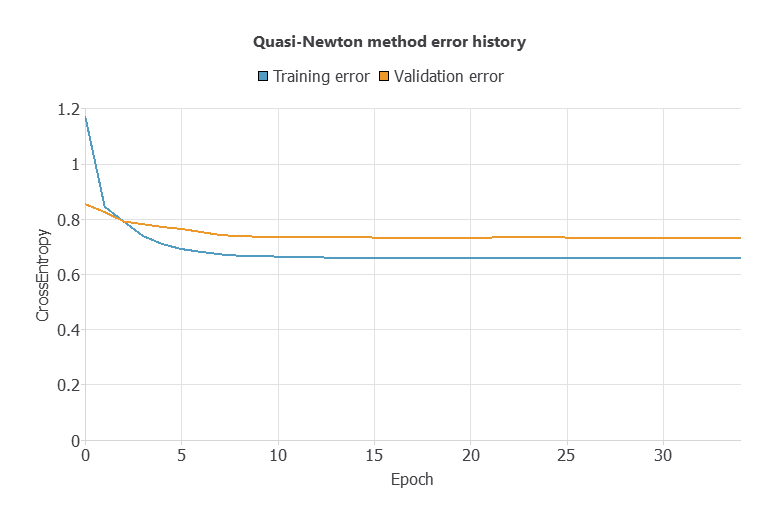
The training strategy minimizes multiclass cross-entropy with the quasi-Newton method and L2 regularization weight 0.01. Across 35 stored epochs, training cross-entropy falls from about 1.170 to 0.660 and selection cross-entropy from about 0.855 to 0.734.
5. Model selection and baseline
No neuron selection, input selection or architecture-selection experiment was performed. The direct 12–3 softmax classifier is both the initial and final model. This restraint is appropriate: adding hidden neurons would not solve centre effects, missing-data bias or the lack of an external cohort.
| Reference | Testing accuracy | Interpretation |
|---|---|---|
| Majority-class baseline | 39.0% | Always predict benign hepatobiliary disease (46 of 118) |
| Fixed categorical model | 66.9% | 79 of 118 testing records classified correctly |
6. Clinical validation
The held-out testing subset contains 46 benign-disease, 40 no-disease and 32 PDAC records. Its class prevalence is therefore 39.0%, 33.9% and 27.1%, respectively. Predictions use the largest of the three scores (an argmax decision rule), not a binary threshold.
A multiclass ROC AUC or precision–recall analysis was not generated for this experiment, so none is claimed. The confusion matrix and per-class metrics provide the auditable evidence available from the exported project.
Testing confusion matrix
| Actual / predicted | Benign disease | No disease | PDAC | Total |
|---|---|---|---|---|
| Benign disease | 28 | 12 | 6 | 46 |
| No disease | 14 | 23 | 3 | 40 |
| PDAC | 3 | 1 | 28 | 32 |
| Total | 45 | 36 | 37 | 118 |
| Class | Precision / PPV | Recall / sensitivity | Specificity | F1 |
|---|---|---|---|---|
| Benign disease | 62.2% | 60.9% | 76.4% | 0.615 |
| No disease | 63.9% | 57.5% | 83.3% | 0.605 |
| PDAC | 75.7% | 87.5% | 89.5% | 0.812 |
| Macro average | 67.3% | 68.6% | 83.1% | 0.677 |
7. Workflow and reproducibility
A credible translational workflow would separate assay processing, model inference and clinical interpretation:
The interactive calculation below reproduces the project. It deliberately shows provenance fields to make the deployed input contract visible; that does not make those fields appropriate predictors for a future clinical model.
Reproduce a three-class model calculation
The default specimen is the reference vector exported from Neural Designer. The calculation runs locally with the exact preprocessing and trained coefficients.
Reproduce the project
The Python package contains the exact 12-input export, schema and reference case. The Neural Designer package preserves the project, split and regenerated analyses. The CSV is the 590-row source table used by this example.
from model import NeuralNetwork
inputs = [0, 0, 0, 1, 0, 47, 1, 21, 2.02, 5.57, 28, 982]
scores = NeuralNetwork().calculate_outputs(inputs)8. Safety, generalizability and governance
- Case-control design. The sample deliberately contains disease groups and does not represent screening prevalence, referral pathways or consecutive clinical practice.
- Internal random split only. There is no external, temporal, prospective or site-held-out validation.
- Centre proxies. Cohort and sample origin may improve internal discrimination by encoding collection or laboratory differences rather than disease biology.
- Missing-data risk. CA19-9 is absent in 40.7% of rows. The stored mean is calculated from the complete project data; production-grade evaluation must fit imputation on training data only and examine informative missingness.
- Uncalibrated scores. Softmax outputs are ranking scores until multiclass calibration is assessed on independent data.
- Assay portability. Units, pre-analytics, instruments, batches and laboratory quality controls must match the validated specification.
- Human expert review. Model scores cannot replace specialist interpretation, confirmatory testing or a documented clinical pathway.
- No early-stage claim. Stage is excluded as a predictor, and this analysis does not establish sensitivity for stage I–II disease.