Inspect machine failure and failure-mode scores
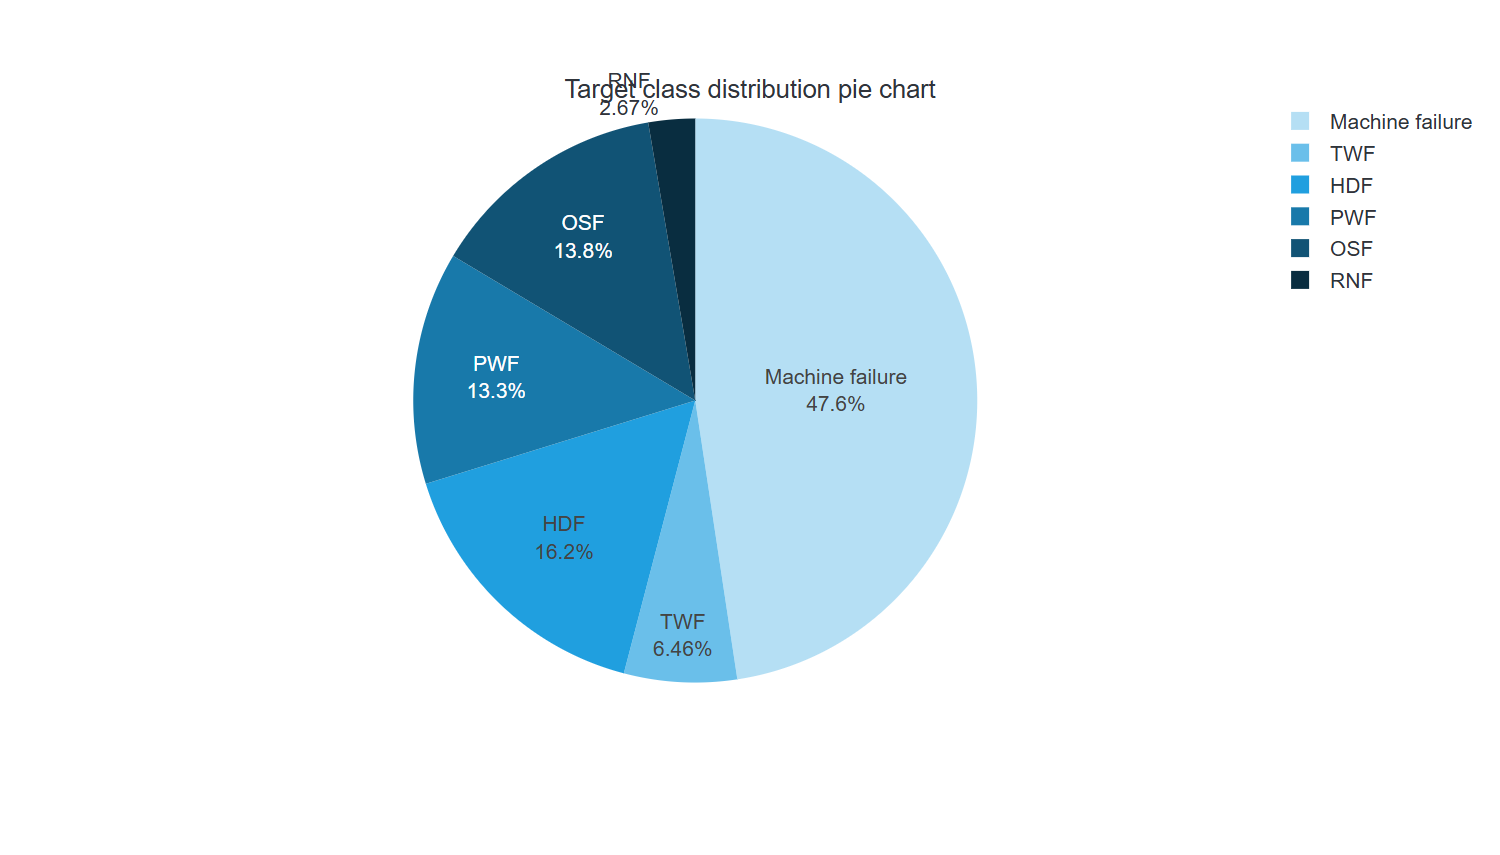
This example uses the synthetic AI4I 2020 predictive-maintenance dataset to model machine failure and five recorded failure modes from operating conditions. The saved model produces six separate scores; multiple failure modes may coexist.
1. Industrial challenge
Maintenance analysts need to distinguish the general failure label from specific mechanisms before deciding which observations need inspection. This example supports model evaluation and inspection planning, not a remaining-useful-life estimate or automatic machine shutdown.
Separate outcomes
Inspect the general failure label and each failure-mode score.
Measure missed failures
Compare sensitivity and false positives at the saved threshold.
Review operating conditions
Use results as evidence for engineering inspection.
2. Data set
AI4I 2020 contains 10,000 synthetic operating records. The source models tool wear, heat dissipation, power, overstrain and random failures. Identifier fields are excluded from the model; product type is encoded alongside operating measurements.
Source: AI4I 2020 Predictive Maintenance Dataset. Dataset license: CC-BY-4.0. The downloadable ZIP includes the adapted data and attribution notices.
| Dataset measure | Saved value |
|---|---|
| Analysis unit | synthetic machine record |
| Records | 10,000 |
| Raw variables | 13 |
| Encoded model inputs | 9 |
| Model outputs | 6 |
| Training roles | 6000 |
| Validation / selection roles | 2000 |
| Testing roles | 2000 |
| Unused roles | 0 |
| Field | Role | Type | Categories |
|---|---|---|---|
| UDI | Input | Numeric | |
| Type | Input | Categorical | H, L, M |
| Air temperature [K] | Input | Numeric | |
| Process temperature [K] | Input | Numeric | |
| Rotational speed [rpm] | Input | Numeric | |
| Torque [Nm] | Input | Numeric | |
| Tool wear [min] | Input | Numeric | |
| Machine failure | Target | Binary | 0, 1 |
| TWF | Target | Binary | 0, 1 |
| HDF | Target | Binary | 0, 1 |
| PWF | Target | Binary | 0, 1 |
| OSF | Target | Binary | 0, 1 |
| RNF | Target | Binary | 0, 1 |
3. Model
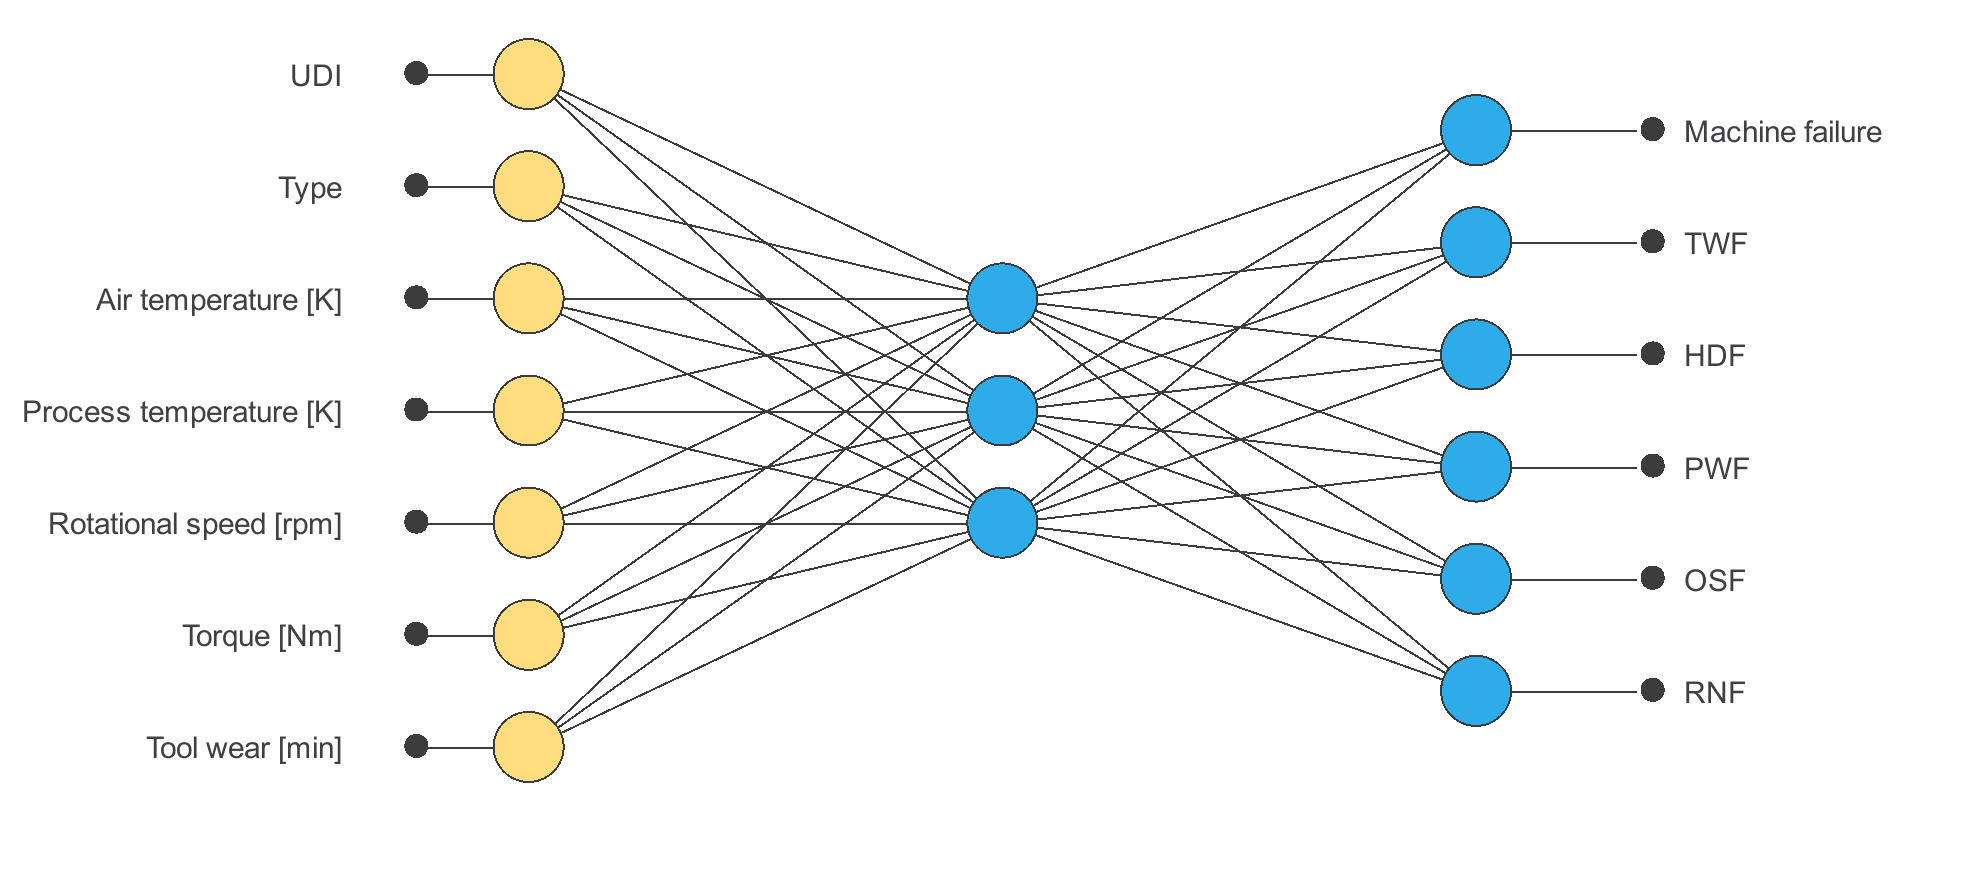
The model has 9 encoded inputs and 6 outputs. No architecture-selection experiment is recorded in this project. The diagram shows the topology used by the saved model.
| Layer | Input shape | Output shape | Activation |
|---|---|---|---|
| Scaling | 9 | 9 | |
| Dense | 9 | 3 | Tanh |
| Dense | 3 | 6 | Sigmoid |
Output values are uncalibrated model scores. Use the output encodings and decision rule documented with this project; do not assume independent sigmoid scores sum to one.
4. Training strategy
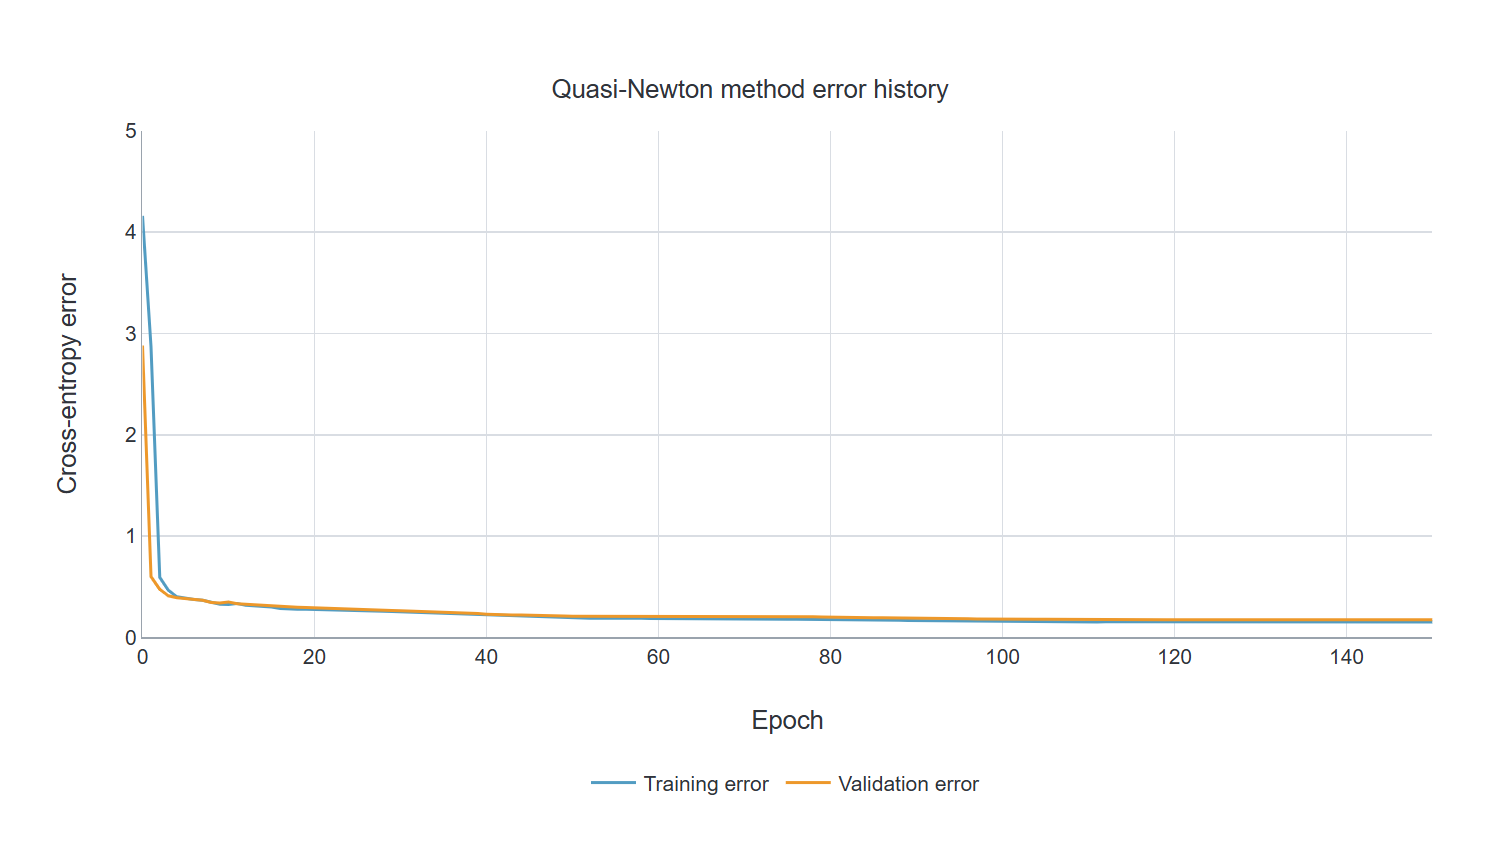
The saved training configuration uses QuasiNewton with CrossEntropy.
Quasi-Newton method results
| Measure | Value |
|---|---|
| Epochs number | 151 |
| Elapsed time | 00:00:01 |
| Stopping criterion | Minimum loss decrease |
| Training error | 0.152 |
| Validation error | 0.173 |
5. Model selection
No model selection experiment is recorded for this version. The validation subset guides fitting where a training report is present; it is distinct from the held-out test rows.
On this test subset a majority-class baseline would correctly classify 96.95% of the records. This baseline does not detect both classes and is not an optimized model.
6. Testing analysis
The figures and tables below refer to the current project’s saved testing analysis. The subset uses testing role 2; it contains 2000 source records.
These operating-point metrics are calculated from the saved confusion counts at threshold 0.5. They apply to Machine failure; the remaining outputs have separate one-versus-rest tables.
Confusion table: Machine failure
| Measure | Predicted positive | Predicted negative | Total |
|---|---|---|---|
| Actual positive | 17 (0.9%) | 44 (2.2%) | 61 (3.0%) |
| Actual negative | 4 (0.2%) | 1935 (96.8%) | 1939 (96.9%) |
| Total | 21 (1.0%) | 1979 (98.9%) | 2000 (100.0%) |
Inspect every output confusion table
Confusion table: TWF
| Measure | Predicted positive | Predicted negative | Total |
|---|---|---|---|
| Actual positive | 0 (0.0%) | 11 (0.6%) | 11 (0.6%) |
| Actual negative | 1 (0.1%) | 1988 (99.4%) | 1989 (99.4%) |
| Total | 1 (0.1%) | 1999 (99.9%) | 2000 (100.0%) |
Confusion table: HDF
| Measure | Predicted positive | Predicted negative | Total |
|---|---|---|---|
| Actual positive | 8 (0.4%) | 7 (0.3%) | 15 (0.8%) |
| Actual negative | 1 (0.1%) | 1984 (99.2%) | 1985 (99.3%) |
| Total | 9 (0.4%) | 1991 (99.6%) | 2000 (100.0%) |
Confusion table: PWF
| Measure | Predicted positive | Predicted negative | Total |
|---|---|---|---|
| Actual positive | 10 (0.5%) | 8 (0.4%) | 18 (0.9%) |
| Actual negative | 2 (0.1%) | 1980 (99.0%) | 1982 (99.1%) |
| Total | 12 (0.6%) | 1988 (99.4%) | 2000 (100.0%) |
Confusion table: OSF
| Measure | Predicted positive | Predicted negative | Total |
|---|---|---|---|
| Actual positive | 8 (0.4%) | 14 (0.7%) | 22 (1.1%) |
| Actual negative | 0 (0.0%) | 1978 (98.9%) | 1978 (98.9%) |
| Total | 8 (0.4%) | 1992 (99.6%) | 2000 (100.0%) |
Confusion table: RNF
| Measure | Predicted positive | Predicted negative | Total |
|---|---|---|---|
| Actual positive | 0 (0.0%) | 3 (0.2%) | 3 (0.2%) |
| Actual negative | 0 (0.0%) | 1997 (99.8%) | 1997 (99.8%) |
| Total | 0 (0.0%) | 2000 (100.0%) | 2000 (100.0%) |
| Test measure | Value |
|---|---|
| Testing records | 2000 |
| Positive cases | 61 |
| Positive prevalence | 3.05% |
| Accuracy | 97.60% |
| Sensitivity / recall | 27.87% |
| Specificity | 99.79% |
| Precision / PPV | 80.95% |
| F1 score | 0.415 |
7. Model deployment
Open the downloaded project in Neural Designer, inspect the dataset roles and preprocessing, then review the saved task report. Use the same input schema and category order when calculating outputs. The ZIP contains the exact current .nd, its source data and the applicable dataset notices.
Workflow: source measurements → schema and availability checks → model output → domain review. Keep model versions, validation evidence and incoming-data monitoring together.
8. Scope and limitations
Randomly held-out synthetic rows do not establish transfer to a real compressor or production line. At threshold 0.5, the saved general-failure classifier misses 44 of 61 positive test rows; accuracy must be interpreted alongside this low recall. Validate against machine- and time-separated records before operational use.
References
- AI4I 2020 Predictive Maintenance Dataset. Stephan Matzka. 10.24432/C5HS5C
- Dataset terms: Creative Commons Attribution 4.0 International. Full attribution and transformations are included in
LICENSES/DATASET-LICENSE.txt. - Current Neural Designer project and saved task report, snapshot 6 October 2026.