Introduction
Colorectal cancer frequently leads to liver metastasis, which significantly worsens patient prognosis. Therefore, early prediction of metastatic risk plays a crucial role in treatment planning.
We developed a neural network integrating 492 genes and clinical variables, trained on the MSK-MET cohort (>25,000 patients), achieving 78% accuracy and 0.85 AUC.
This approach shows strong potential as a decision-support tool, and healthcare professionals can explore it using Neural Designer
Contents
The following index outlines the steps for performing the analysis.
1. Model type
In this example, we develop a binary classification model to predict whether a patient will develop liver metastasis. Specifically, the model outputs 1 if metastasis occurs and 0 otherwise.
By framing the problem this way, we allow the neural network to identify patterns associated with metastatic progression. Consequently, clinicians can use the model’s output as decision-support information during follow-up and therapeutic planning.
2. Data set
Data source
The dataset (3537 instances, 510 variables) for a binary classification problem (target: distant_metastasis_liver, [yes or no]).
Variables
The following list summarizes the variables information:
Patient information
age at first metastasis diagnostic – Age at which the first metastasis was diagnosed (years).
age_at_surgical_procedure – Age of the patient at the time of surgery (years).
sex – Patient sex (e.g., male, female).
race_category – Patient race or ethnicity.
Tumor characteristics
cancer_type_detailed – Specific cancer type: colon, rectal, or colorectal.
cancer_subtype – Subtype of the tumor.
primary_tumor_site – Location of the primary tumor.
tumour_mutational_burden – Number of mutations per megabase in the tumor.
tumor_purity – Fraction of tumor cells in the sample.
fraction_genome_altered – Proportion of the genome with copy number alterations.
Metastasis information
metastasis_count – Total number of metastases observed.
metastasis primary site count – Number of metastases in the primary tumor site.
microsatellite instability score – Score indicating level of microsatellite instability.
microsatellite instability type – Type of microsatellite instability detected.
Genomic features
- gene variables – Presence or absence of mutations in each of 492 genes, capturing the tumor’s genomic profile.
Target variable
distant_metastasis_liver (yes or no) – whether liver metastasis is present or not.
Variables distributions
We can calculate variable distributions; the figure shows a pie chart comparing metastatic versus non-metastatic tumors in the dataset.
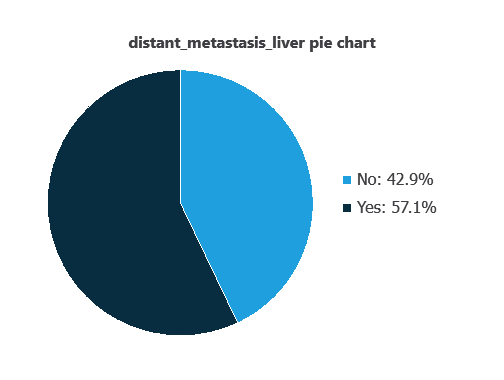
As depicted in the image, liver metastatic tumors represent 57% of the samples, while non-metastatic tumors account for 43%.
Input-target correlations
The inputs-targets correlations indicate which factors most influence whether a tumor develops liver metastases and, therefore, are more relevant to our analysis.
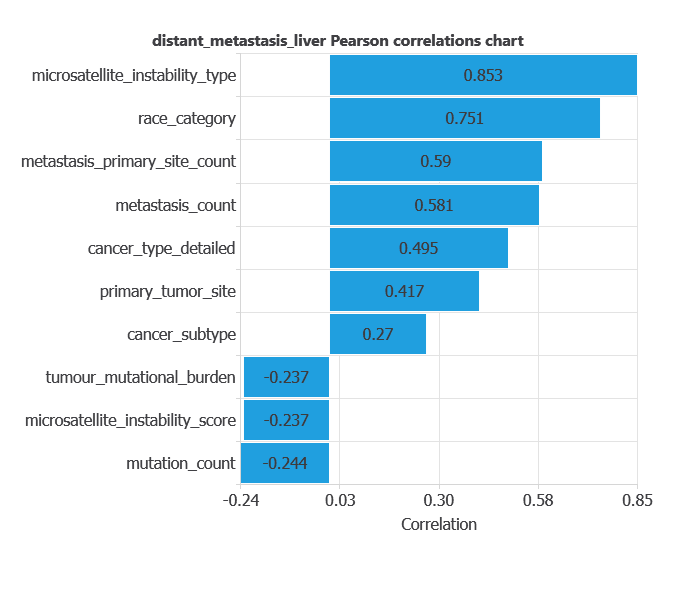
Here, the most correlated variables with liver metastases are microsatellite_instability_type, race_category, and metastasis_primary_site_count.
3. Neural network
A neural network is an artificial intelligence model inspired by the way the human brain processes information. In practice, it organizes information into layers that work sequentially. First, the input layer receives the variables. Then, hidden layers process and transform that information. Finally, the output layer provides the probability that a tumor belongs to a given class. To generate these predictions, the network learns from historical data. Specifically, it identifies patterns that distinguish benign tumors from metastatic ones. As a result, the model can estimate the likelihood of metastasis for new patients.
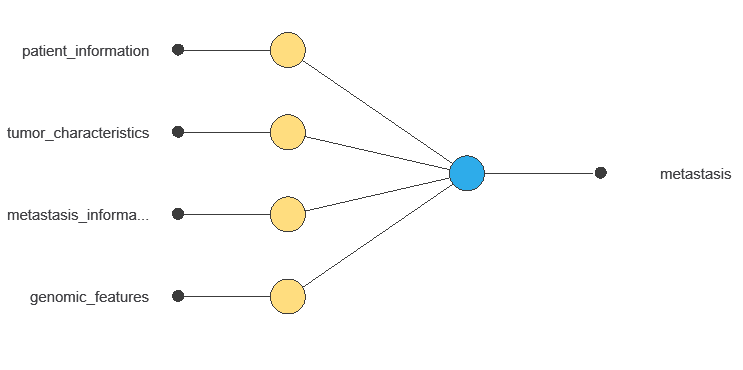
The network uses 497 input variables to output the probability of liver metastasis for each patient, with connections showing each variable’s contribution to the prediction.
4. Training strategy
Training a neural network involves defining a loss function to measure prediction error and selecting an optimization algorithm to adjust the model parameters. In this way, the network learns from data while maintaining its ability to generalize to new cases.
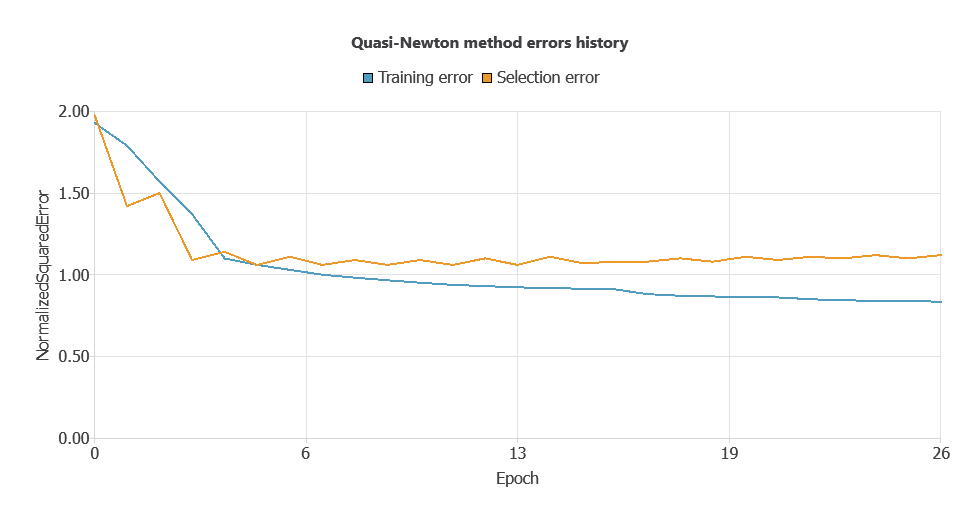
During training, the model achieved a training error of 0.3969 and a validation error of 0.8127. However, this gap between training and validation performance suggests potential overfitting.
Therefore, we apply input selection to remove irrelevant variables. By doing so, we aim to reduce model complexity and improve generalization on unseen data.
5. Model selection
Due to the high number of input neurons and relatively low evaluation metrics, a neuron selection process was performed.
The selection method trains several network architectures with varying numbers of neurons and identifies the configuration that achieves the lowest selection error.
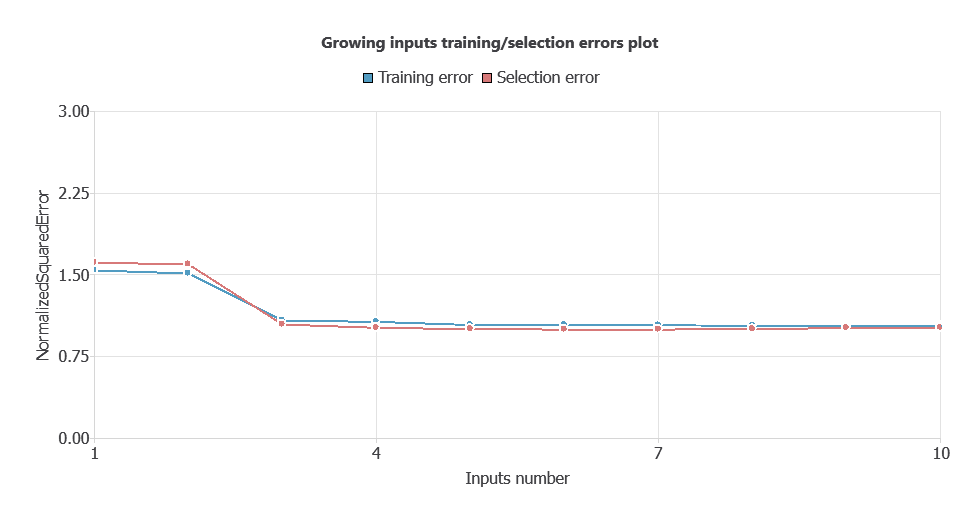
After performing input selection, the model was reduced to 34 inputs (by removing less relevant features), which lowered the difference between the training and selection errors, and simplified the network architecture.
As shown in the chart, both training error and selection error decrease as the number of inputs is optimized, resulting in a more efficient network with improved performance.
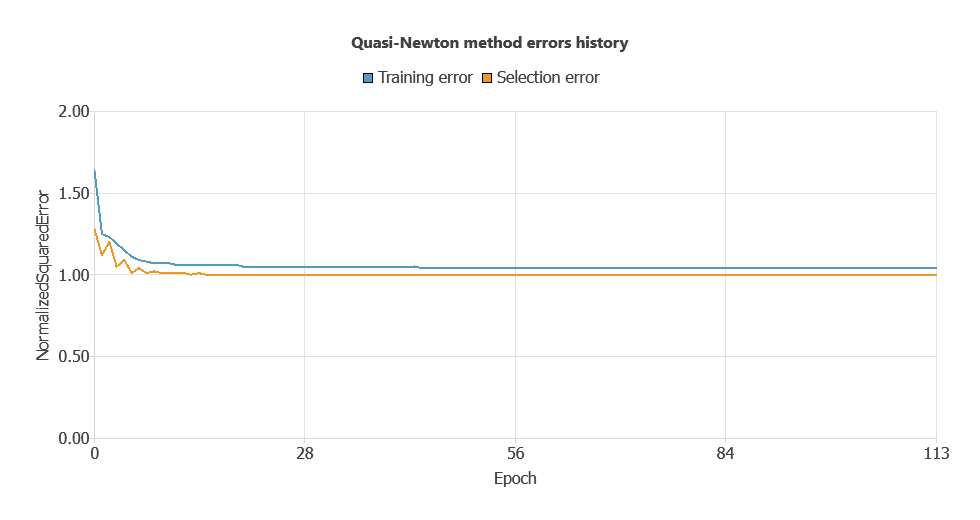
The new model was trained for accuracy and stability, with steadily decreasing training and selection errors (1.036 and 0.997 WSE), demonstrating effective learning and strong generalization to new patients.
6. Testing analysis
The testing analysis aims to validate the performance of the generalization properties of the trained neural network.
ROC curve
The ROC curve is a standard tool for evaluating classification models, showing how well the model distinguishes between two classes by comparing predicted outcomes with actual results, such as the presence or absence of liver metastasis.
A random classifier scores 0.5, while a perfect classifier scores 1.
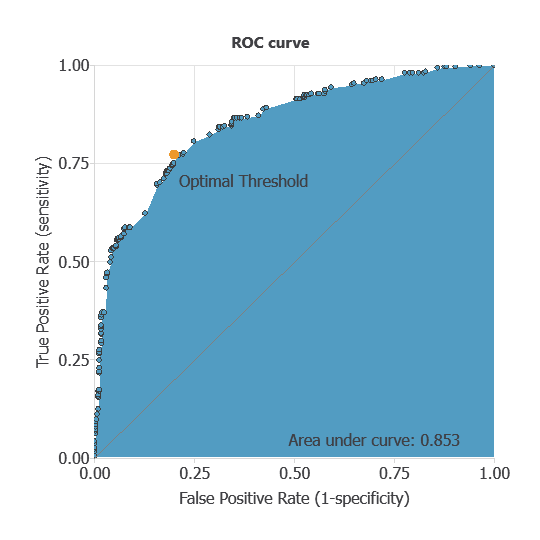
The AUC obtained is 0.85, showing that the model performs exceptionally well at distinguishing between patients with metastasis and those without it.
Confusion matrix
The confusion matrix shows the model’s performance by comparing predicted and actual outcomes. It includes:
True positives – patients correctly predicted as deceased
False positives – patients incorrectly predicted as deceased
False negatives – patients incorrectly predicted as surviving
True negatives – patients correctly predicted as surviving
For a decision threshold of 0.5, the confusion matrix was:
| Predicted positive | Predicted negative | |
|---|---|---|
| Real positive | 329 | 73 |
| Real negative | 82 | 223 |
Binary classification
Using a classification threshold of 0.3, the performance of this binary classification model is summarized with standard measures.
Accuracy: 78.1% of patient outcomes were correctly predicted.
Error rate: 21.9% of cases were misclassified.
Sensitivity: 81.8% of deceased patients were correctly identified.
Specificity: 73.1% of surviving patients were correctly identified.
These measures indicate that the model is highly effective at predicting patient survival outcomes.
7. Model deployment
Once validated, the neural network can be saved for deployment, allowing clinicians to use patients’ clinical data to predict breast cancer mortality.
Neural Designer automatically exports the trained model, enabling seamless integration as a diagnostic support tool.
Conclusions
The machine learning model predicts liver metastasis in colon cancer patients with 78% accuracy and 0.85 AUC.
Key factors—metastasis count, primary site involvement, and mutations in KIT, RB1, and PIK3R1—align with known clinical markers.
Its strong generalization makes it a valuable tool to support risk assessment, clinical decision-making, and treatment planning.
References
- The data for this problem has been taken from the cBioportal Repository MSK-MET (Memorial Sloan Kettering – Metastatic Events and Tropisms) dataset.