Modelling yacht residuary resistance
A hydrodynamic surrogate can help compare hull configurations within an experimental domain. This example estimates residuary resistance from six hull and flow descriptors and examines the response to Froude number.
1. Industrial challenge
Early hull studies compare resistance across geometric proportions and operating conditions. This surrogate reproduces a prepared experimental dataset and should be checked on separate hull designs before broader use.
Hull geometry
Describe the design with the retained dimensionless inputs.
Resistance response
Inspect the predicted residuary resistance and its directional curve.
Design comparison
Assess transfer to new hull families with a grouped evaluation.
2. Data set
The UCI Delft Yacht Hydrodynamics dataset contains 308 records. The supplied project uses 186 training, 61 validation and 61 testing records. Repeated operating conditions for related hulls make hull-level validation important when claiming transfer to a new design.
The downloadable project, saved report and supplied source CSV define the exact version used here. Repository: original dataset/source record.
| Subset | Records |
|---|---|
| Training | 186 |
| Validation / selection | 61 |
| Testing | 61 |
| Unused | 0 |
| Variable | Role | Type | Encoding | Unit |
|---|---|---|---|---|
| center_of_buoyancy | Input | Numeric | As supplied | |
| prismatic_coefficient | Input | Numeric | As supplied | |
| length_displacement | Input | Numeric | As supplied | |
| beam_draught_ratio | Input | Numeric | As supplied | |
| length_beam_ratio | Input | Numeric | As supplied | |
| froude_number | Input | Numeric | As supplied | |
| resistance | Target | Numeric | source resistance units |
Interactive chart: resistance distribution. Enable JavaScript to explore it.
Interactive chart: resistance vs. froude_number scatter chart. Enable JavaScript to explore it.
Interactive chart: resistance Pearson correlations chart. Enable JavaScript to explore it.
3. Model
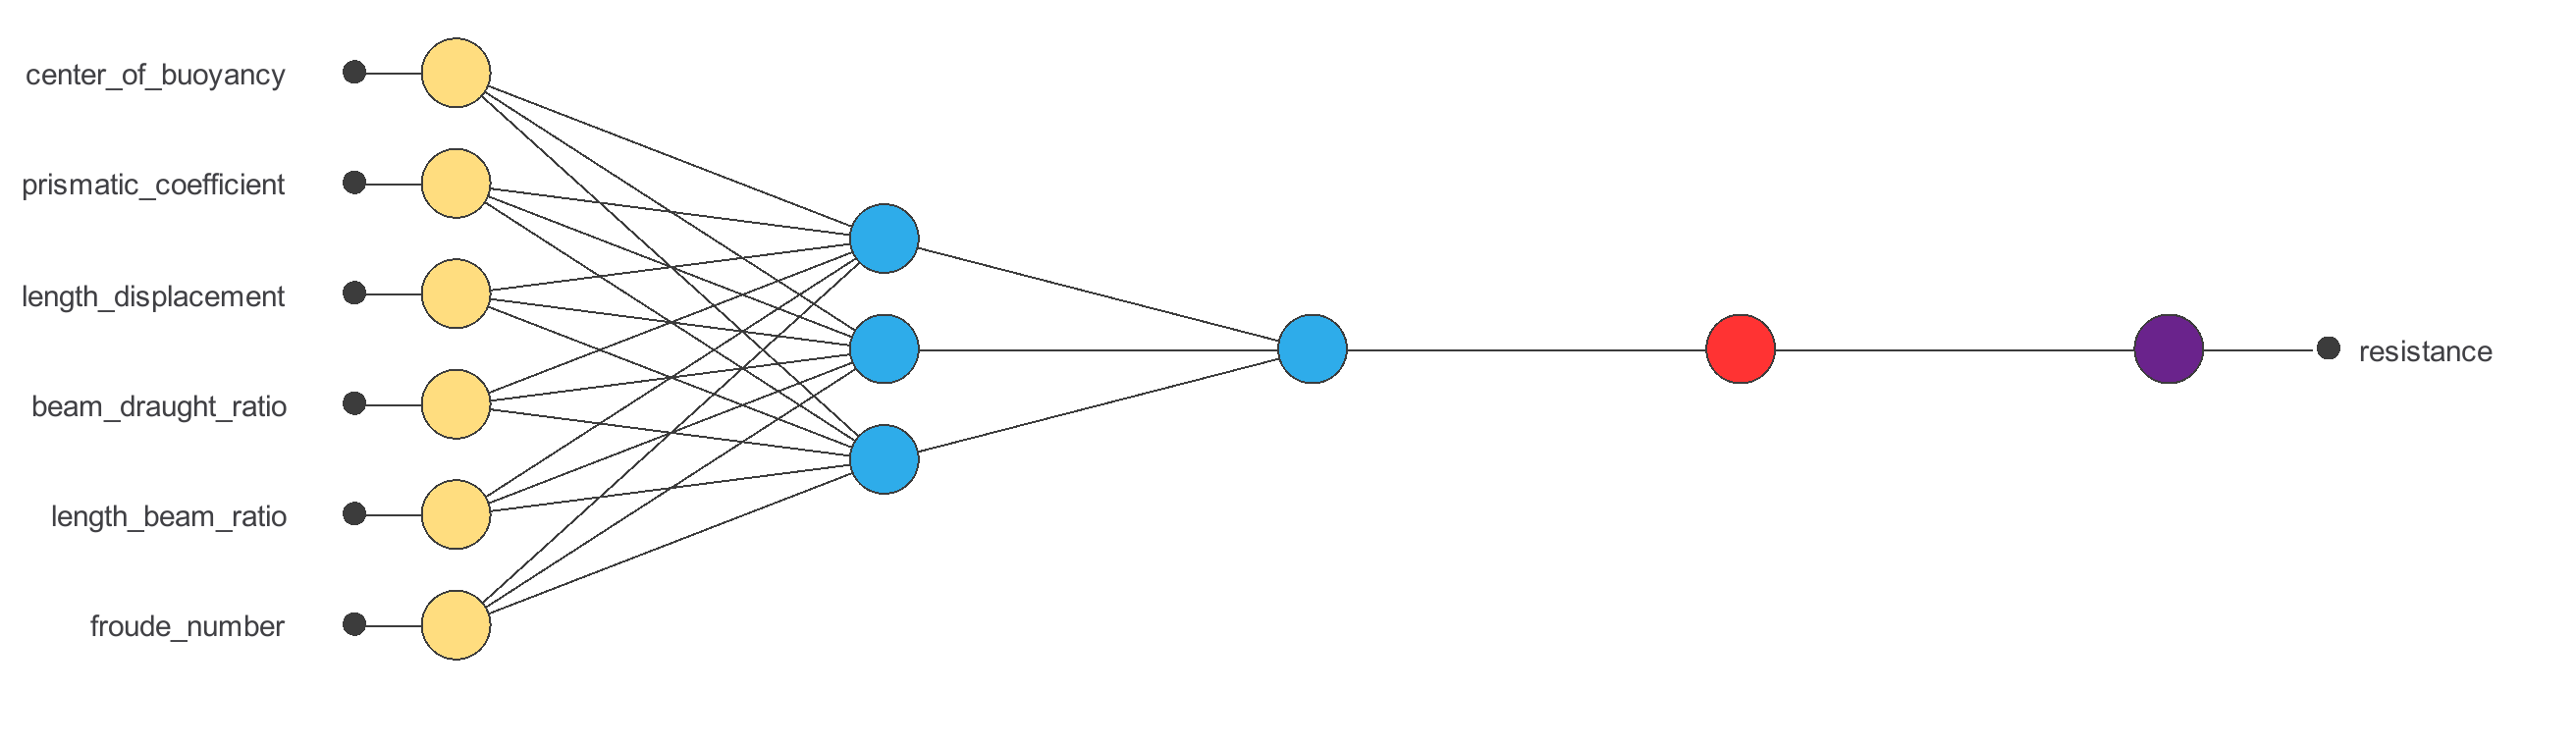
The final model has 6 encoded input features and 1 outputs. The following dimensions describe the final saved network.
| Layer | Input shape | Output shape | Activation |
|---|---|---|---|
| Scaling | 6 | 6 | — |
| Dense | 6 | 3 | Tanh |
| Dense | 3 | 1 | Identity |
| Unscaling | 1 | 1 | — |
| Clamping | 1 | 1 | — |
The final output is a continuous estimate. Scaling, unscaling and any bounds follow the saved implementation; the calculator does not silently impose physical constraints.
4. Training strategy
The saved training configuration uses NormalizedSquaredError with QuasiNewton. Training minimizes the recorded objective; the validation subset monitors generalization during fitting. The testing subset is used for the evaluation below.
Interactive chart: Quasi-Newton method error history. Enable JavaScript to explore it.
Quasi-Newton method results
| Measure | Value |
|---|---|
| Epochs number | 42 |
| Elapsed time | 00:00:00 |
| Stopping criterion | Minimum loss decrease |
| Training error | 0.003 |
| Validation error | 0.002 |
5. Model selection
No model selection experiment is recorded in this supplied project. The displayed architecture is the trained model used for testing; earlier article claims about a different selected architecture do not apply to this version.
6. Testing analysis
The final model is evaluated on 61 testing observations. MAE, RMSE and prediction R² below are computed from the exact testing pairs stored by Neural Designer. Errors retain each target’s original units.
| Target | Unit | MAE | RMSE | Prediction R² | Pearson r² |
|---|---|---|---|---|---|
| resistance | source resistance units | 1.352 | 2.314 | 0.981 | 0.996 |
The native goodness-of-fit task reports squared Pearson correlation (r²). Prediction R² here is 1 − squared prediction error / squared deviation from the test mean. They measure different properties: a strongly correlated prediction can still have a bias or an incorrect scale.
Interactive chart: resistance goodness-of-fit chart. Enable JavaScript to explore it.
7. Model deployment
Validated inputs → saved preprocessing → neural network → score or estimate → domain review. The ZIP contains the original project, source CSV, schema, test metrics and standalone interactive chart exports. The project hash in the schema identifies this exact version.
Directional response at a fixed reference point
Inspect the saved reference point
| Measure | Variable | Value |
|---|---|---|
| 1 | center_of_buoyancy | -2.3 |
| 2 | prismatic_coefficient | 0.53 |
| 3 | length_displacement | 4.34 |
| 4 | beam_draught_ratio | 2.81 |
| 5 | length_beam_ratio | 3.15 |
| 6 | froude_number | 0.175 |
Interactive chart: resistance – froude_number directional output. Enable JavaScript to explore it.
Explore the exported model
This research demonstration runs locally in your browser. Values outside the training range are outside the validated domain and are rejected. A valid input range does not guarantee that a combination is physically or operationally plausible.
This is not a certified control or protection system.
8. Scope and limitations
The model is not a substitute for a towing-tank campaign or a validated hydrodynamic calculation. Predictions may be negative because the exported model does not clamp resistance. Restrict exploratory use to represented configurations, preserve coupled geometric constraints and review physical plausibility.
No external validation or independent calibration study is included. Preprocessing statistics and model choices should be refitted within a prospective or grouped validation design. Correlations and directional responses describe associations, not causes. Human review is required before an operational decision.