Evaluating response to a banking campaign
Campaign capacity is limited. This example uses customer and contact information to rank the likelihood of the recorded conversion outcome, then examines the trade-off between missed conversions and unnecessary contacts.
1. Business decision
A campaign response model can help organize customer analysis when its inputs are available at the time of contact. The saved schema omits call duration, which would only be known after a call.
Before contact
Use customer and campaign information in the prepared schema.
Response ranking
Examine how subscription outcomes vary with the model score.
Contact decisions
Combine response evidence with separately measured costs and intervention effects.
2. Data set
This prepared version of the UCI Bank Marketing data contains 4,120 records. The local schema excludes call duration. Several fields contain missing values and use the application's mean imputation; this preprocessing was not fitted exclusively on the training subset.
The downloadable project, saved report and supplied source CSV define the exact version used here. Repository: original dataset/source record.
| Subset | Records |
|---|---|
| Training | 2472 |
| Validation / selection | 824 |
| Testing | 824 |
| Unused | 0 |
| Variable | Role | Type | Encoding | Unit |
|---|---|---|---|---|
| age | Input | Numeric | As supplied | |
| job | Input | Numeric | As supplied | |
| marital_status | Input | Categorical | divorced; married; single | As supplied |
| education | Input | Numeric | As supplied | |
| default | Input | Binary | 0; 1 | As supplied |
| balance | Input | Numeric | As supplied | |
| housing | Input | Binary | 0; 1 | As supplied |
| loan | Input | Binary | 0; 1 | As supplied |
| contact_type | Input | Binary | 0; 1 | As supplied |
| day | Input | Numeric | As supplied | |
| month | Input | Numeric | As supplied | |
| campaing_contacts | Input | Numeric | As supplied | |
| last_contact | Input | Numeric | As supplied | |
| previous_contacts | Input | Numeric | As supplied | |
| previous_conversion | Input | Binary | 0; 1 | As supplied |
| conversion | Target | Binary | 0; 1 | As supplied |
Interactive chart: conversion pie chart. Enable JavaScript to explore it.
Interactive chart: conversion Pearson correlations chart. Enable JavaScript to explore it.
3. Model
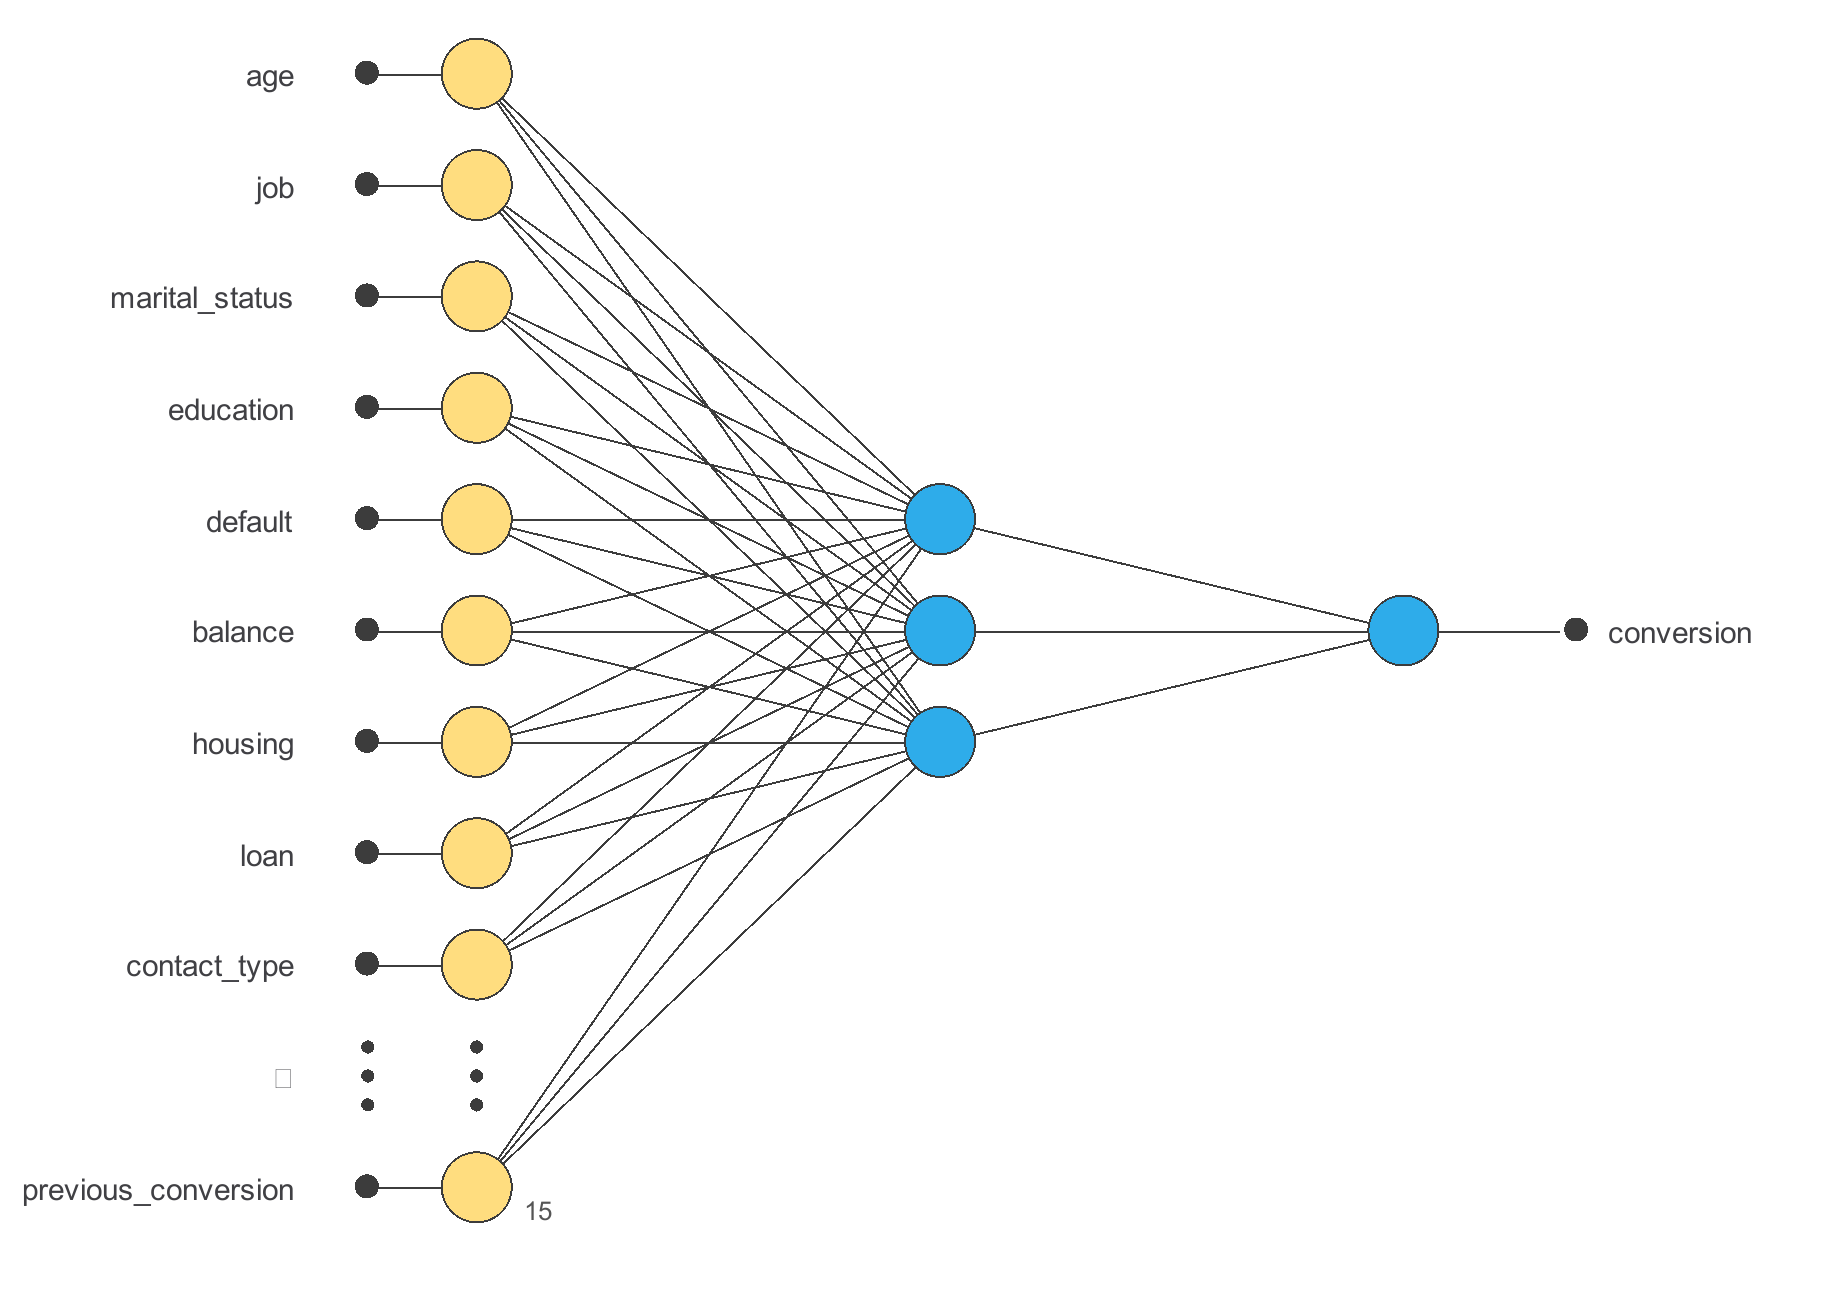
The final model has 17 encoded input features and 1 outputs. The following dimensions describe the final saved network.
| Layer | Input shape | Output shape | Activation |
|---|---|---|---|
| Scaling | 17 | 17 | — |
| Dense | 17 | 3 | Tanh |
| Dense | 3 | 1 | Sigmoid |
Output semantics: the sigmoid score increases toward 1; 0 is the other class. Calibration has not been evaluated, so scores are not presented as calibrated probabilities.
4. Training strategy
The saved training configuration uses WeightedSquaredError with QuasiNewton. Training minimizes the recorded objective; the validation subset monitors generalization during fitting. The testing subset is used for the evaluation below.
Interactive chart: Quasi-Newton method error history. Enable JavaScript to explore it.
Quasi-Newton method results
| Measure | Value |
|---|---|
| Epochs number | 184 |
| Elapsed time | 00:00:01 |
| Stopping criterion | Minimum loss decrease |
| Training error | 0.522 |
| Validation error | 0.536 |
5. Model selection
No model selection experiment is recorded in this supplied project. The displayed architecture is the trained model used for testing; earlier article claims about a different selected architecture do not apply to this version.
A transparent test-set comparator is the majority-class rule, with accuracy 88.3%. This is a baseline for interpretation, not an alternative model fitted on the test labels.
6. Testing analysis
The final classifier is evaluated on 824 testing records. The confusion counts below were reproduced from the saved model. Rows are actual classes and columns are predicted classes. The decision threshold is 0.5 on the score for 1.
Test class prevalence is shown by the support counts. Accuracy is 70.5% and macro F1 is 0.571. ROC AUC is 0.731. The native ROC optimal threshold is descriptive of this test set and is not an independently validated operating policy.
| Actual / predicted | 0 | 1 | Total |
|---|---|---|---|
| 0 | 521 | 207 | 728 |
| 1 | 36 | 60 | 96 |
| Class | Test cases | Sensitivity / recall | Specificity | Precision / PPV | F1 |
|---|---|---|---|---|---|
| 0 | 728 | 71.6% | 62.5% | 93.5% | 0.811 |
| 1 | 96 | 62.5% | 71.6% | 22.5% | 0.331 |
Interactive chart: ROC chart. Enable JavaScript to explore it.
7. Model deployment
Validated inputs → saved preprocessing → neural network → score or estimate → domain review. The ZIP contains the original project, source CSV, schema, test metrics and standalone interactive chart exports. The project hash in the schema identifies this exact version.
Directional response at a fixed reference point
Inspect the saved reference point
| Measure | Variable | Value |
|---|---|---|
| 1 | age | 33 |
| 2 | job | 2 |
| 3 | marital_status | married |
| 4 | education | 3 |
| 5 | default | 0 |
| 6 | balance | 79 |
| 7 | housing | 1 |
| 8 | loan | 0 |
| 9 | contact_type | 0 |
| 10 | day | 22 |
| 11 | month | 10 |
| 12 | campaing_contacts | 2 |
| 13 | last_contact | 335 |
| 14 | previous_contacts | 2 |
| 15 | previous_conversion | 0 |
Interactive chart: conversion – age directional output. Enable JavaScript to explore it.
Explore the exported model
This research demonstration runs locally in your browser. Values outside the training range are outside the validated domain and are rejected. A valid input range does not guarantee that a combination is physically or operationally plausible.
This is a research demonstration, not a validated decision policy.
8. Evidence and limitations
Past campaign outcomes depend on who was contacted and when. A new campaign needs temporal validation, verified contact-time feature availability, calibration and an experiment measuring incremental conversions. Codes such as job and education are numeric in this supplied project; their order is a modelling assumption.
No external validation or independent calibration study is included. Preprocessing statistics and model choices should be refitted within a prospective or grouped validation design. Correlations and directional responses describe associations, not causes. Human review is required before an operational decision.
Confidence intervals, subgroup performance, calibration curves and decision-cost validation are not established by these tasks. Predictive values apply to the observed test class distribution and may change when prevalence shifts.