Forecast Poland’s annual inflation rate
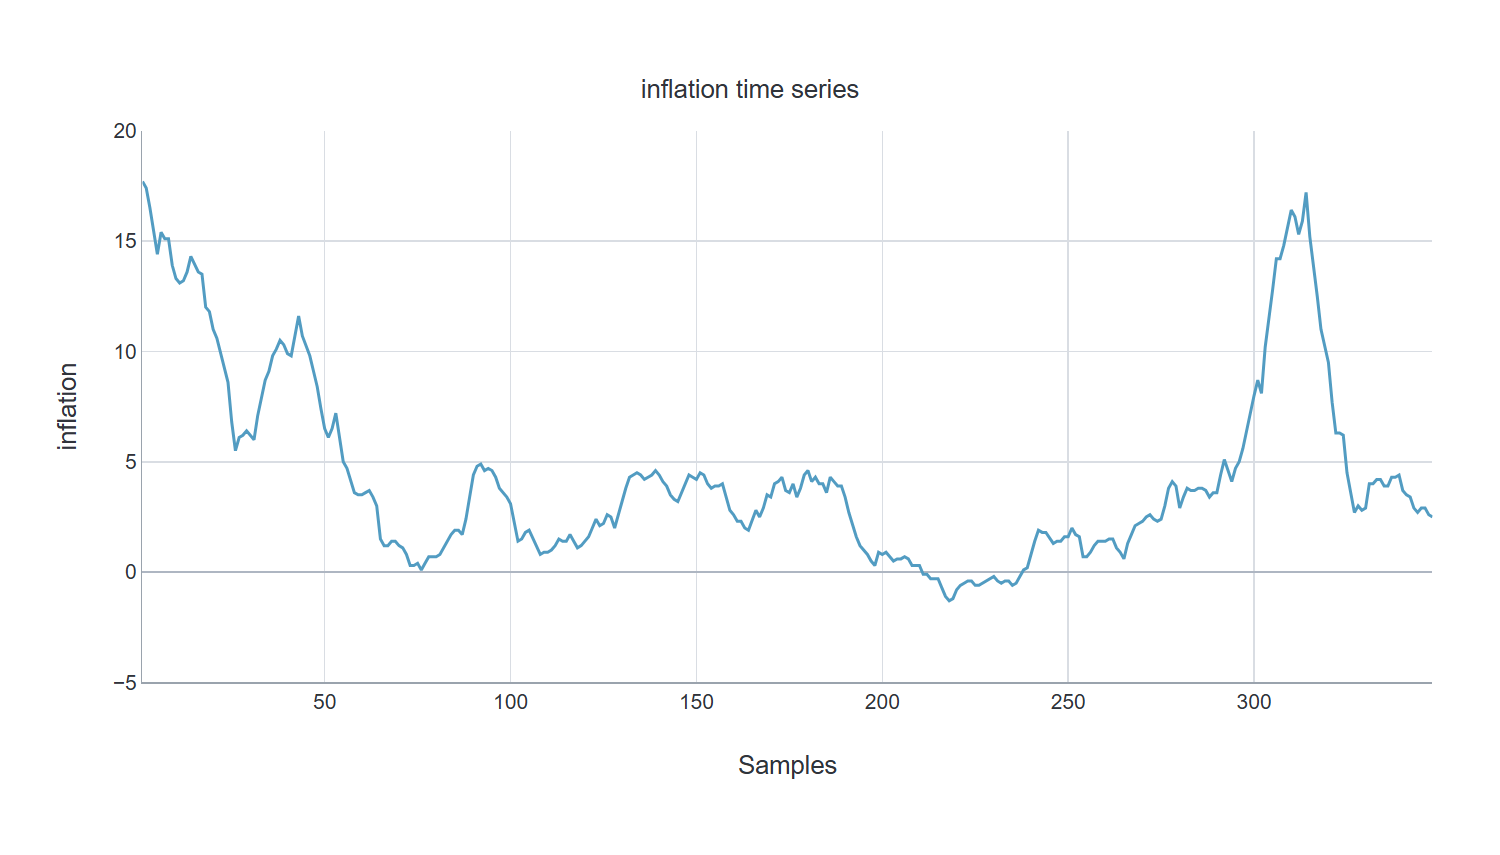
Use 12 monthly observations to forecast the next three observations of Poland’s all-items HICP annual rate of change. The source contains 348 monthly values from January 1997 through December 2025.
1. Business decision
Economic analysts can compare short-horizon forecasts of an explicitly defined price-index rate. The target is the change relative to the same month one year earlier, expressed in percent, not a month-on-month inflation rate.
Defined rate
Forecast year-on-year HICP inflation.
Three horizons
Inspect one-, two- and three-month-ahead outputs.
Chronological evidence
Retain the ordered series and saved subset roles.
2. Data set
The Eurostat series is prc_hicp_manr, filtered to PL, CP00, RCH_A and monthly frequency. The derived file retains the chronological numeric series; Neural Designer constructs the lagged inputs and three-step targets.
Source: HICP – monthly data (annual rate of change): Poland, all-items. Dataset license: EC-Reuse-2011-833-EU. The downloadable ZIP includes the adapted data and attribution notices.
| Dataset measure | Saved value |
|---|---|
| Analysis unit | monthly observation |
| Records | 348 |
| Raw variables | 1 |
| Encoded model inputs | 12 |
| Model outputs | 3 |
| Training roles | 221 |
| Validation / selection roles | 55 |
| Testing roles | 57 |
| Unused roles | 15 |
| Field | Role | Type | Categories |
|---|---|---|---|
| inflation | InputTarget | Numeric |
3. Model
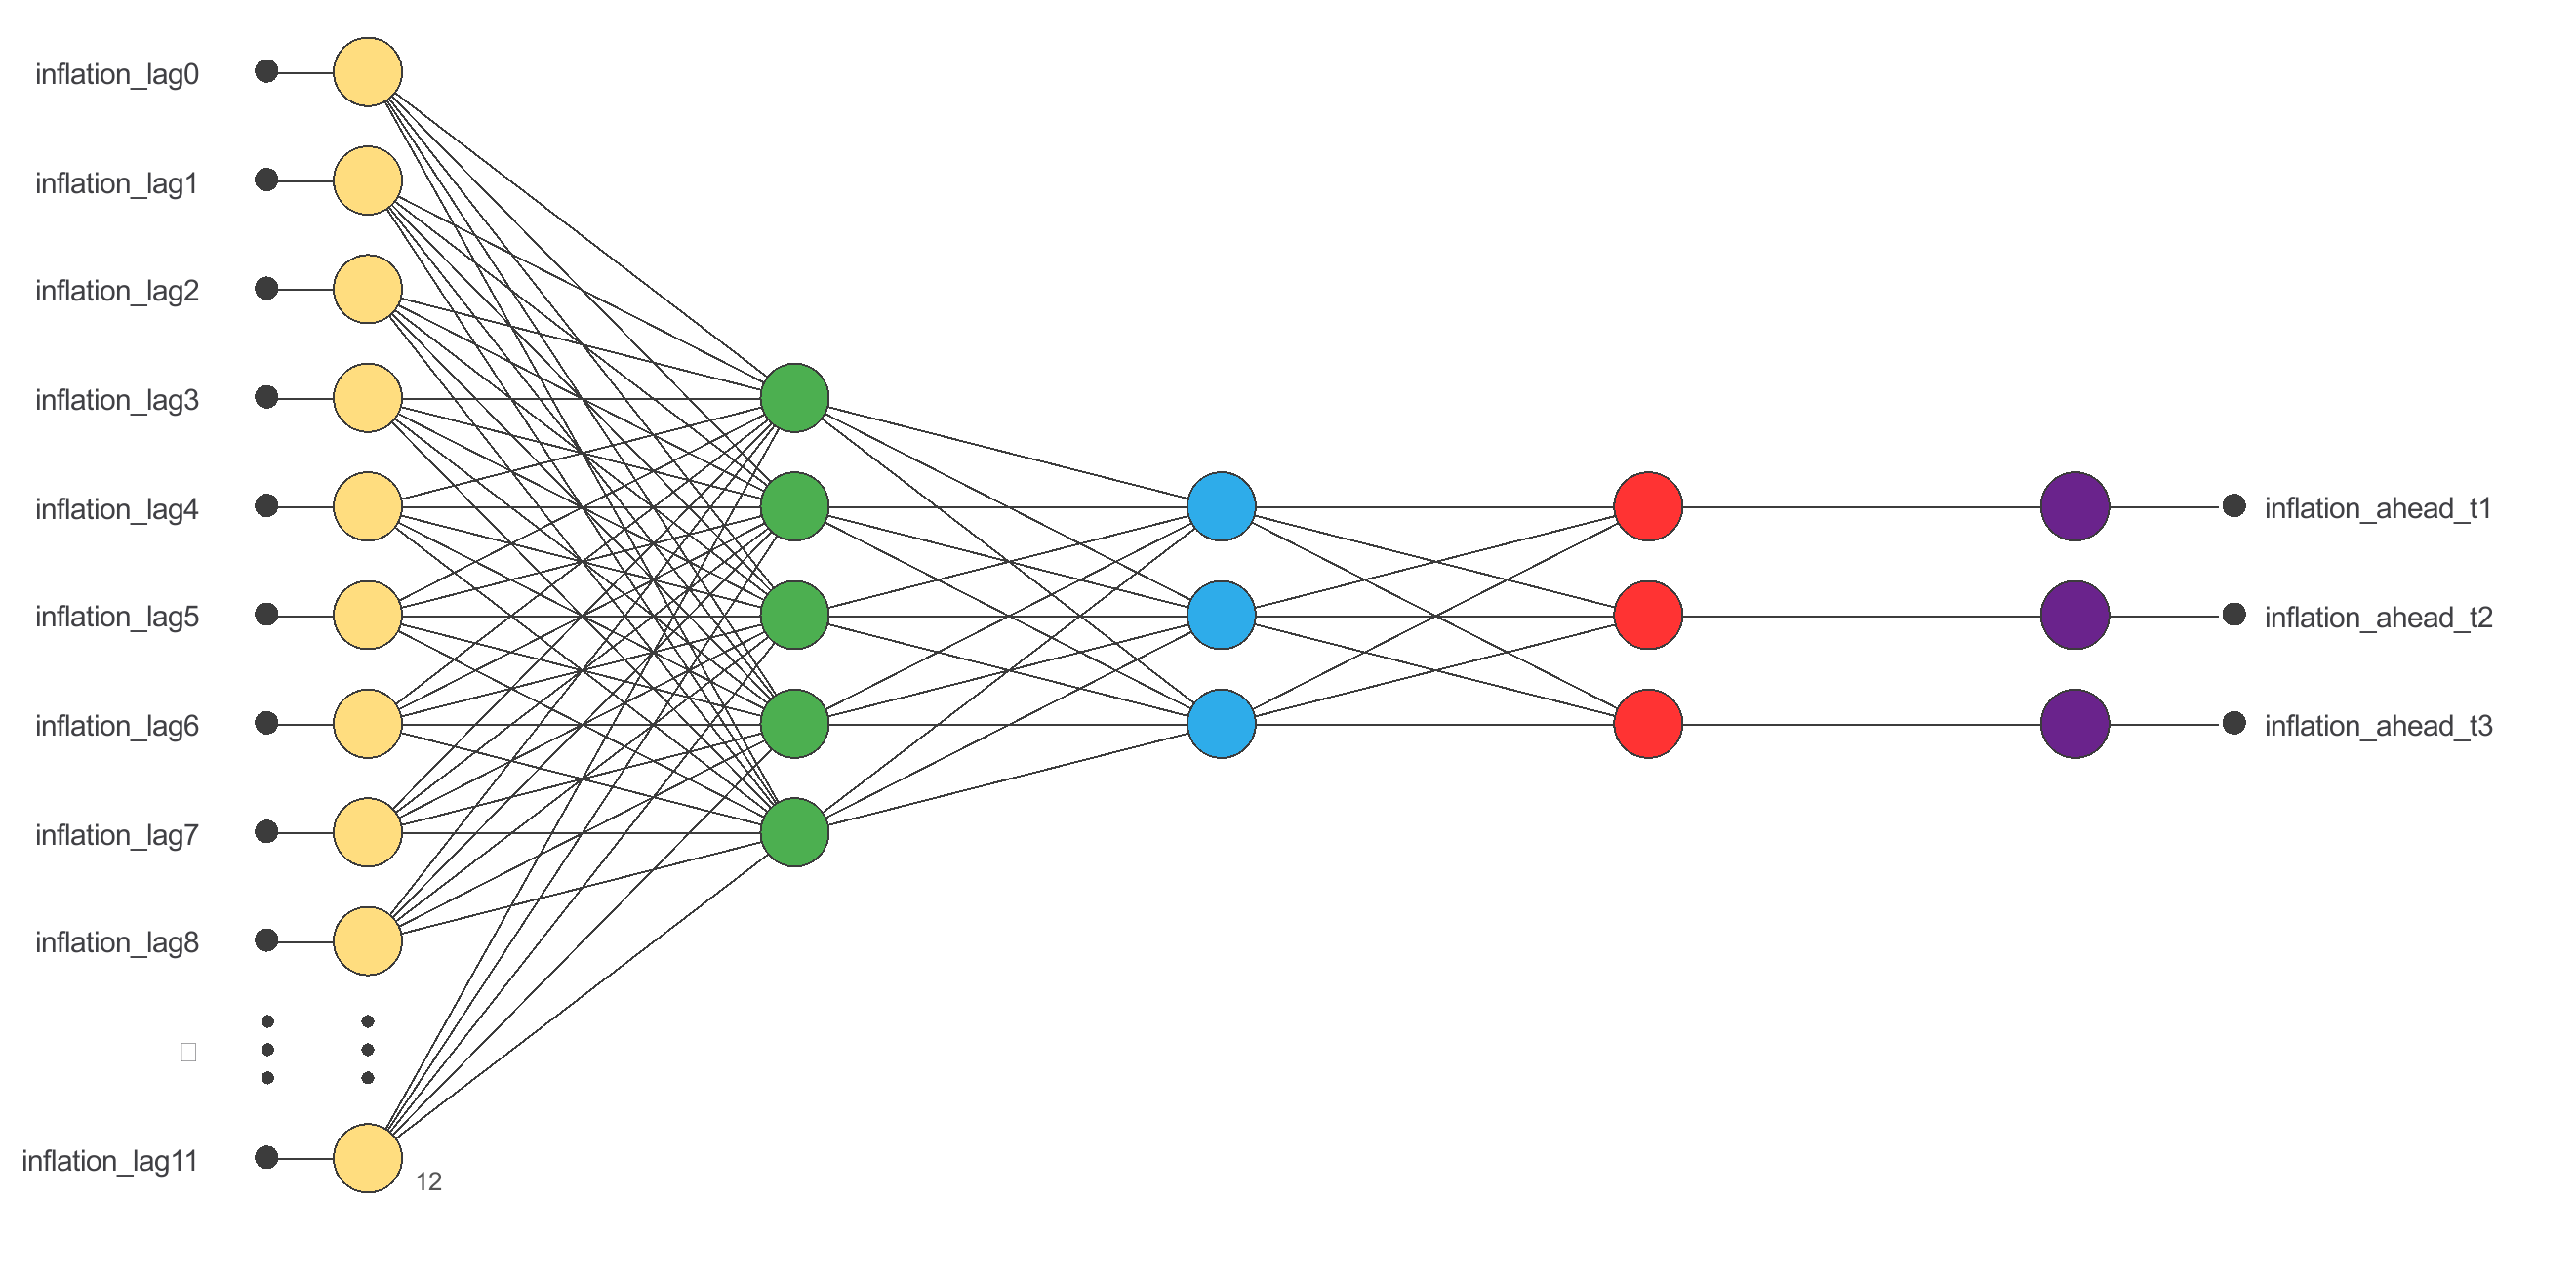
The model has 12 encoded inputs and 3 outputs. No architecture-selection experiment is recorded in this project. The diagram shows the topology used by the saved model.
| Layer | Input shape | Output shape | Activation |
|---|---|---|---|
| Scaling | 12 × 1 | 12 × 1 | |
| Recurrent | 12 × 1 | 5 | Tanh |
| Dense | 5 | 3 | Identity |
| Unscaling | 3 | 3 | |
| Clamping | 3 | 3 |
4. Training strategy
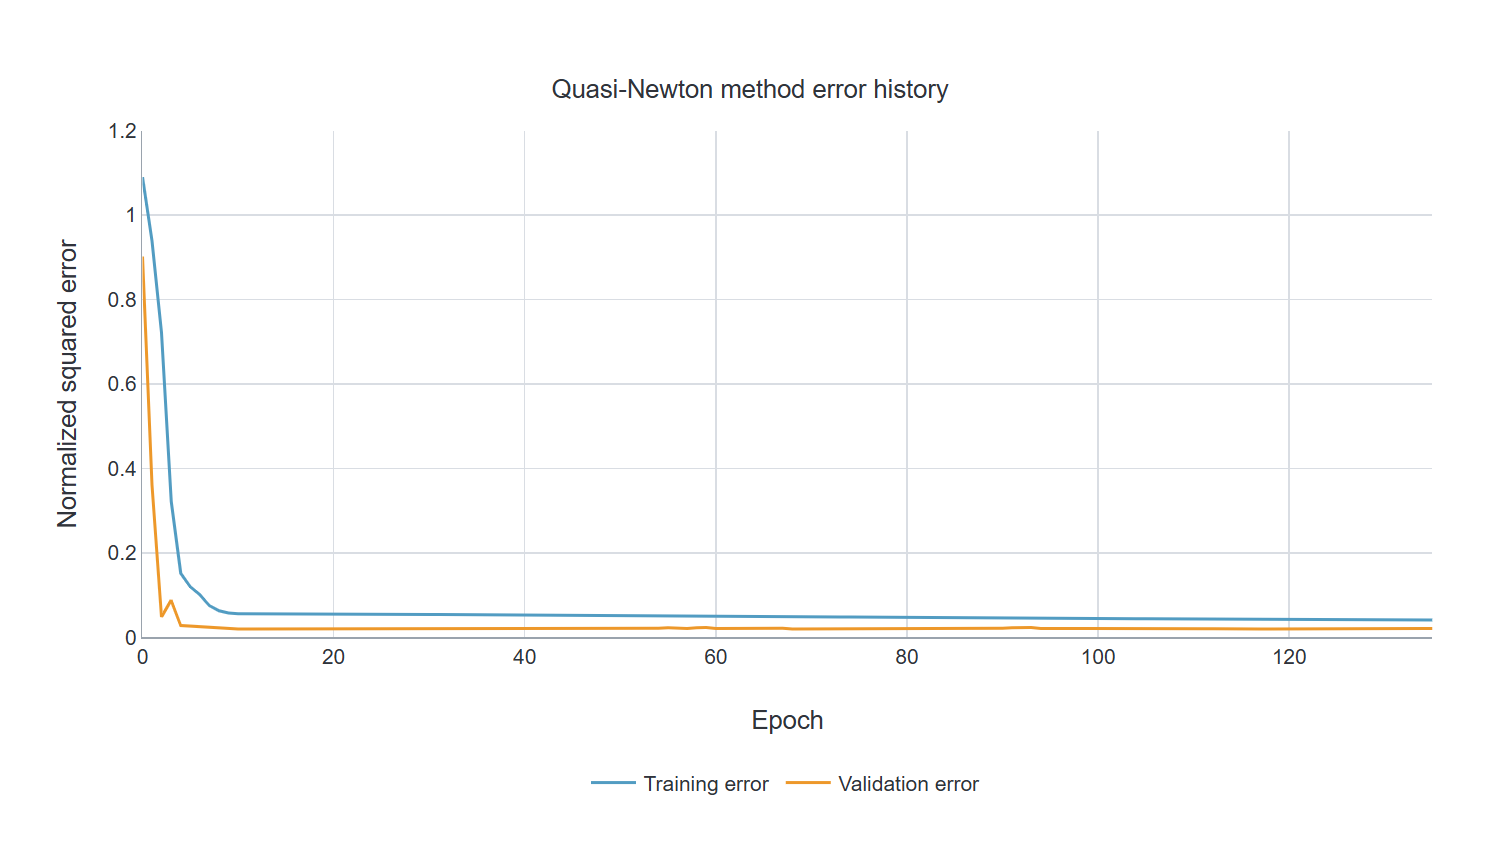
The saved training configuration uses QuasiNewton with NormalizedSquaredError.
Quasi-Newton method results
| Measure | Value |
|---|---|
| Epochs number | 136 |
| Elapsed time | 00:00:00 |
| Stopping criterion | Maximum validation error increases |
| Training error | 0.054 |
| Validation error | 0.02 |
5. Model selection
No model selection experiment is recorded for this version. The validation subset guides fitting where a training report is present; it is distinct from the held-out test rows.
A persistence forecast provides a transparent baseline for future evaluation. No independently verified persistence score is bundled with this saved run, so no numerical improvement over that baseline is claimed.
6. Testing analysis
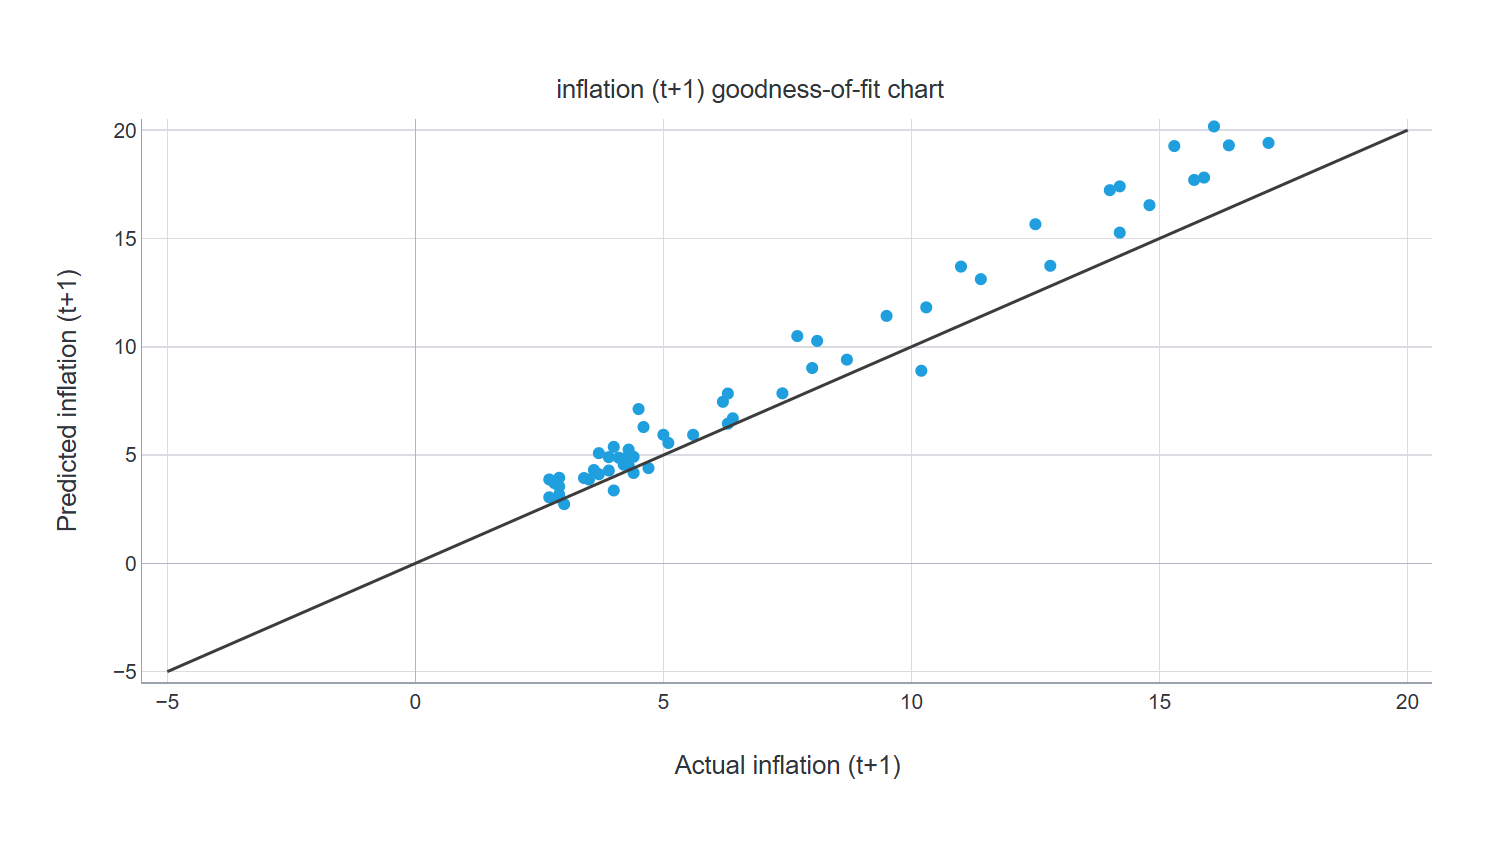
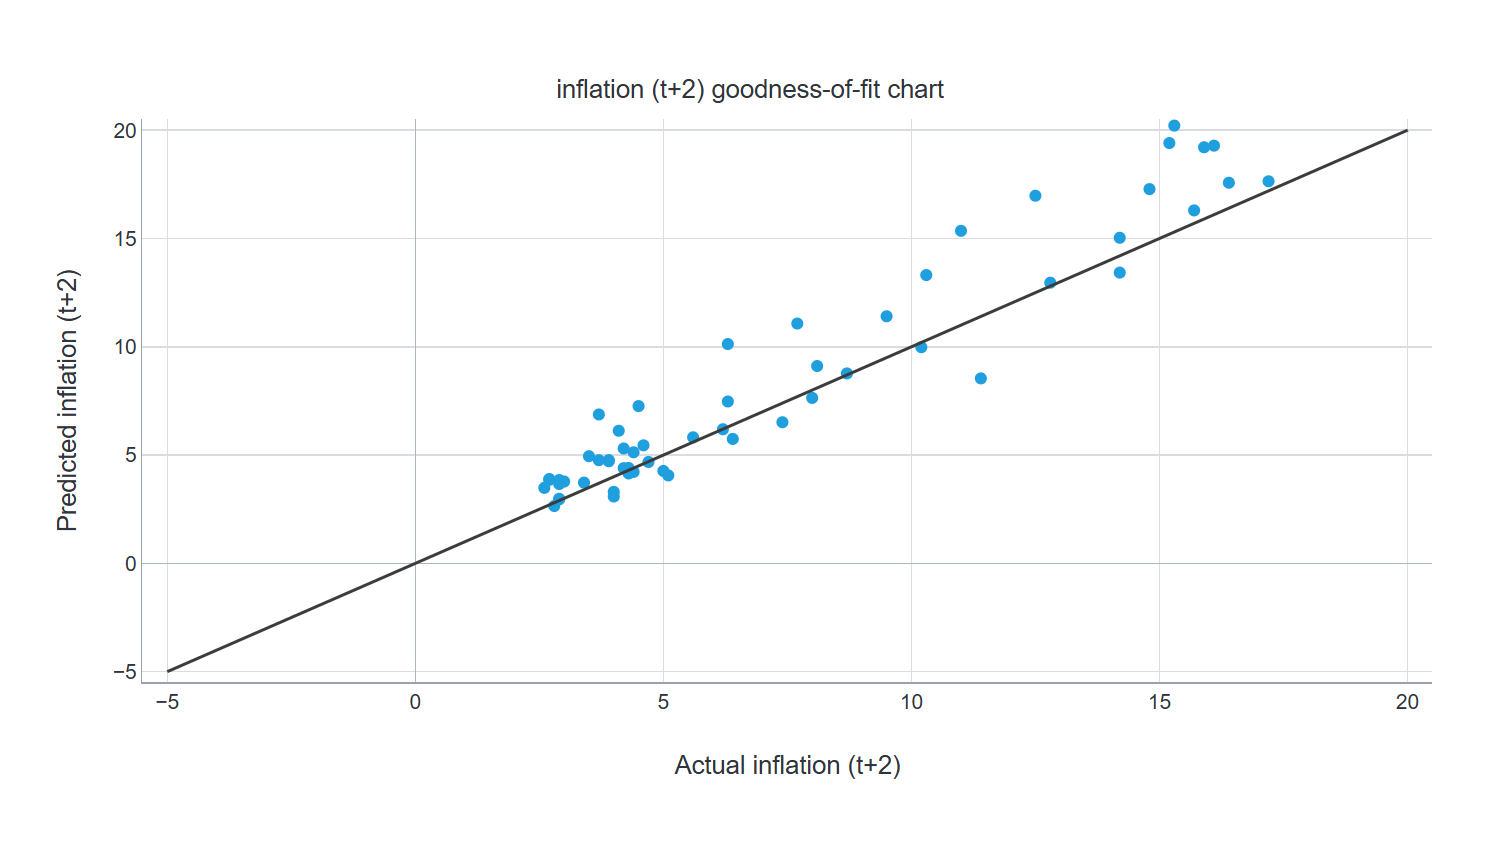
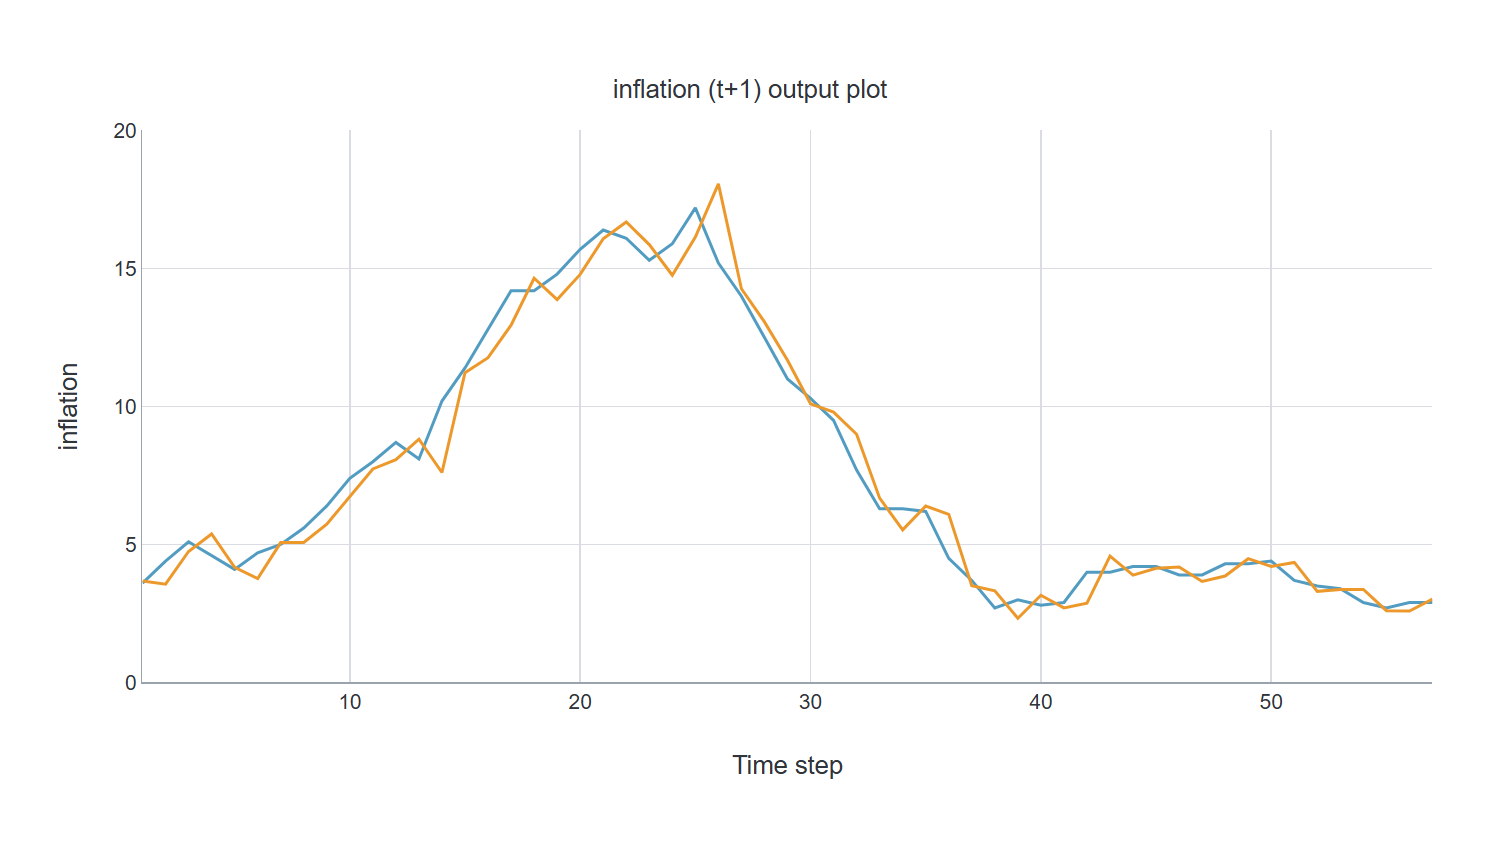
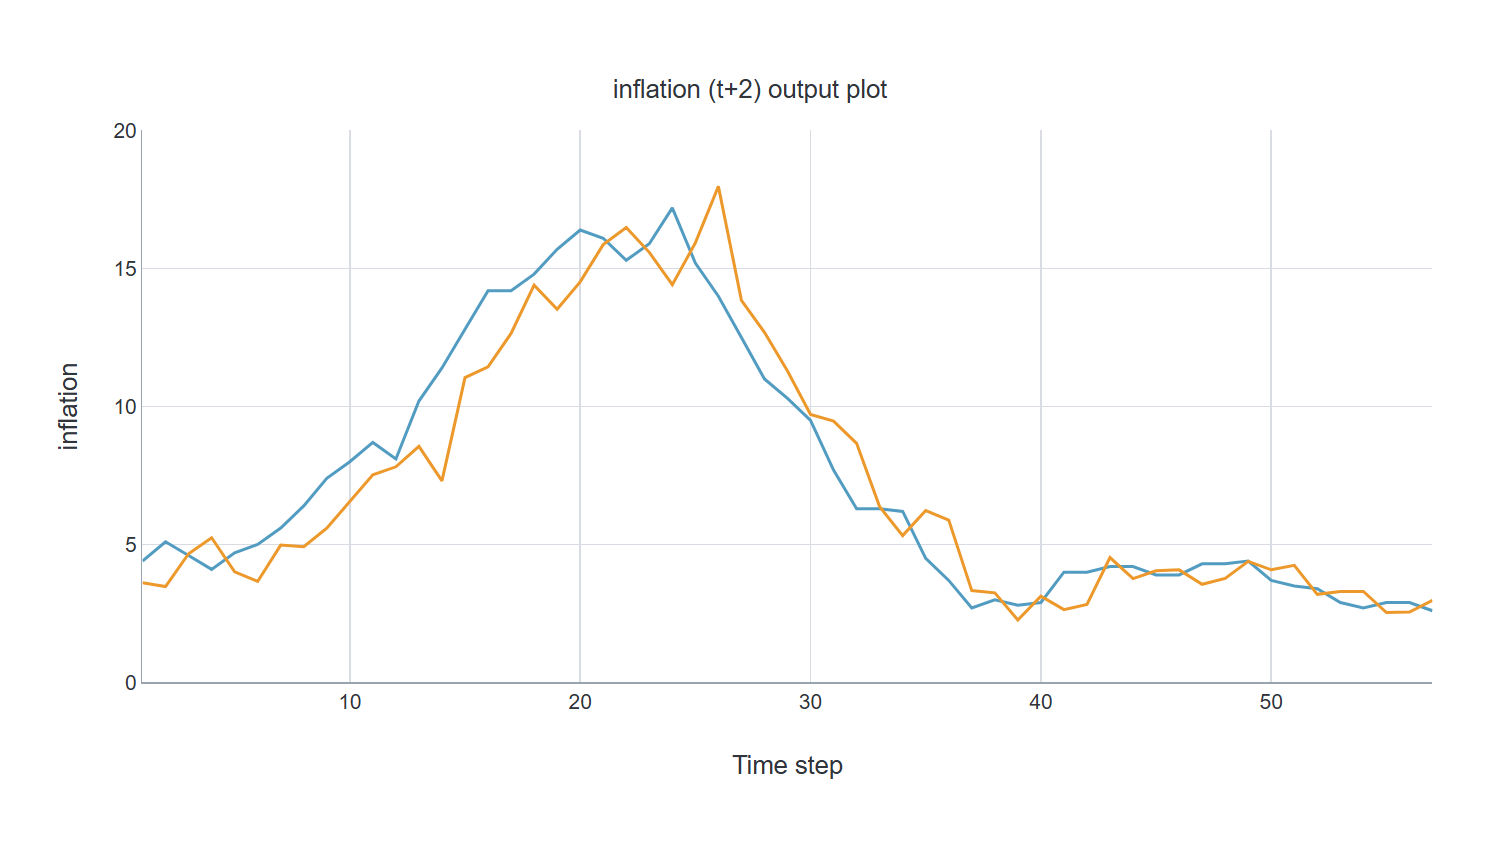
The figures and tables below refer to the current project’s saved testing analysis. The subset uses testing role 2; it contains 57 source records.
inflation (t+1) goodness-of-fit parameters
| Measure | Value |
|---|---|
| Determination | 0.969 |
inflation (t+2) goodness-of-fit parameters
| Measure | Value |
|---|---|
| Determination | 0.909 |
inflation (t+3) goodness-of-fit parameters
| Measure | Value |
|---|---|
| Determination | 0.837 |
Average goodness-of-fit parameter
| Measure | Value |
|---|---|
| Average determination | 0.905 |
7. Model deployment
Open the downloaded project in Neural Designer, inspect the dataset roles and preprocessing, then review the saved task report. Use the same input schema and category order when calculating outputs. The ZIP contains the exact current .nd, its source data and the applicable dataset notices.
Workflow: source measurements → schema and availability checks → model output → domain review. Keep model versions, validation evidence and incoming-data monitoring together.
8. Evidence and limitations
Economic regimes and policy changes can alter the relationship. Adjacent forecast windows are dependent; future evaluation should roll the origin forward and fit preprocessing only on the training period. A persistence baseline should accompany an operational comparison. The saved testing roles and report figures are the evidence for this run.
References
- HICP – monthly data (annual rate of change): Poland, all-items. European Commission, Eurostat. 10.2908/prc_hicp_manr
- Dataset terms: Eurostat copyright notice and free re-use of data policy. Full attribution and transformations are included in
LICENSES/DATASET-LICENSE.txt. - Current Neural Designer project and saved task report, snapshot 6 October 2026.