Classify historical lung-cancer survey records with a transparent baseline model
This reproducible Neural Designer example maps 15 demographic, behavioural and symptom fields to the binary label in a 309-row public survey table. On 61 internally held-out records, the fixed direct classifier reaches ROC AUC 0.989 and detects 50 of 54 positive labels at threshold 0.50. The collection lacks the provenance and reference-standard documentation required for clinical screening or diagnosis.
1. Clinical question and intended use
The model reproduces the binary label attached to records in the supplied survey table. Its defensible use is machine-learning education, software verification and retrospective benchmarking. It does not estimate eligibility for lung-cancer screening and cannot establish whether a person has cancer.
Real screening programmes use defined eligibility criteria and validated methods. For example, current US guidance identifies low-dose computed tomography (LDCT) as the recommended screening test for eligible high-risk adults; this questionnaire model is not an alternative.
Inspect imbalance
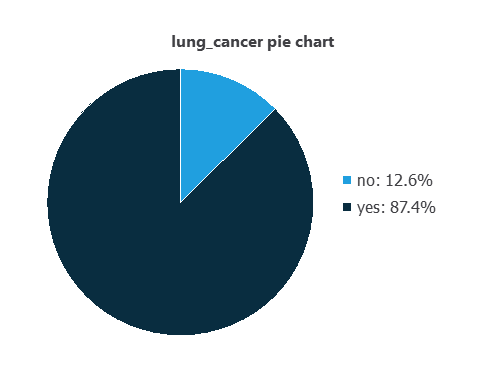
Understand why 87.4% positive labels make accuracy alone a misleading performance summary.
Audit a compact model
Review a direct 15-input sigmoid classifier with sixteen trainable parameters and exact exported coefficients.
Expose validation risk
See how duplicated rows and undocumented label provenance limit otherwise strong internal metrics.
2. Cohort, measurements and endpoint
The local lung_cancer.csv contains 309 rows, 15 inputs and one binary target. It is a cleaned copy of the widely redistributed Kaggle “Survey Lung Cancer” table. No values are missing, age spans 21–87 years, and all other predictors are binary categories.
| Subset | Rows | yes | no | Purpose |
|---|---|---|---|---|
| Training | 187 | 160 | 27 | Estimate coefficients |
| Selection | 61 | 56 | 5 | Monitor optimization |
| Testing | 61 | 54 | 7 | Internal final analysis |
| Total | 309 | 270 | 39 | Random 60/20/20 row split |
| Group | CSV fields | Encoding |
|---|---|---|
| Demographics | gender, age | Female/male; age in years |
| Behaviour and context | smoking, alcohol_consuming, peer_pressure | No/yes |
| Symptoms and history | yellow_fingers, anxiety, chronic_disease, fatigue, allergy, wheezing, coughing, shortness_of_breath, swallowing_difficulty, chest_pain | No/yes |
| Target | lung_cancer | no=0, yes=1 |
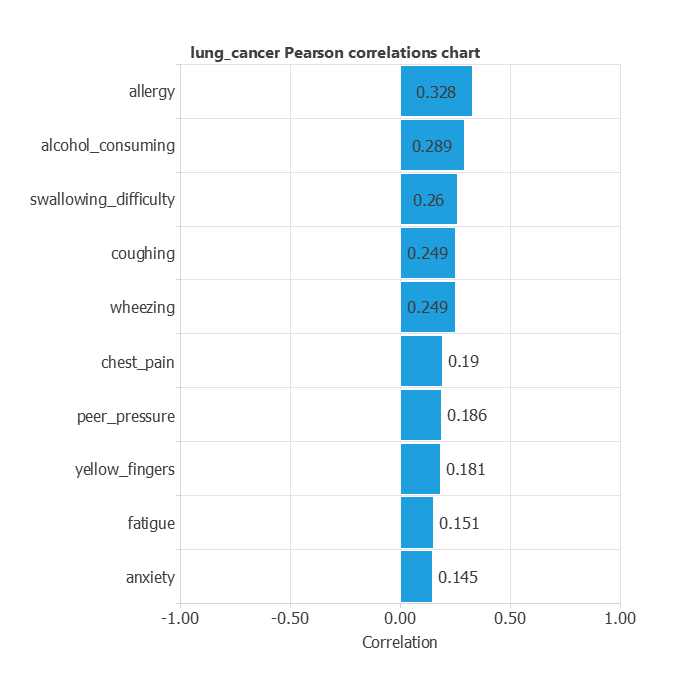
allergy, alcohol_consuming and swallowing_difficulty have the largest displayed coefficients. These are coding-dependent associations, not causal effects, clinical importance or verified risk factors.3. Model
Fourteen binary inputs use minimum–maximum scaling and age uses mean-and-standard-deviation scaling. They connect directly to one sigmoid output, with no hidden layer. The fixed model contains fifteen weights and one bias, so it is a logistic classifier expressed in Neural Designer’s network framework.
lung_cancer=yes. The sigmoid output has not been independently calibrated, so it is a model score—not an individual probability of cancer.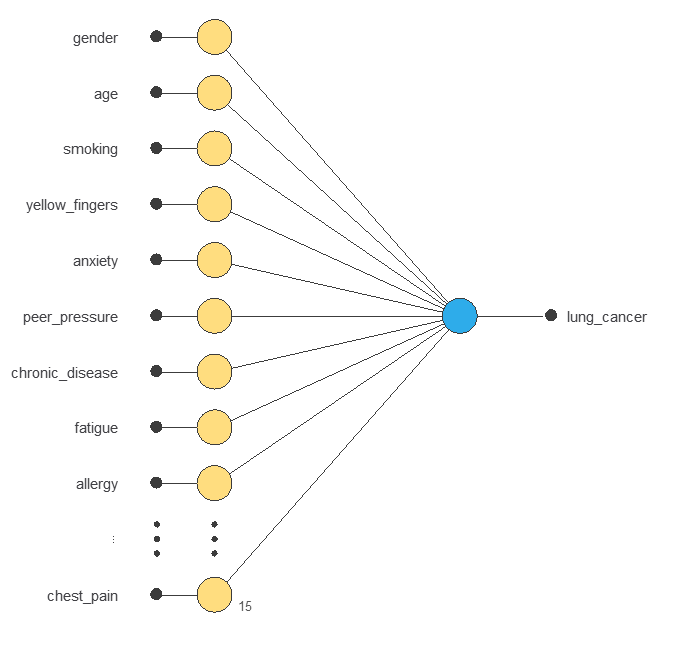
4. Training strategy
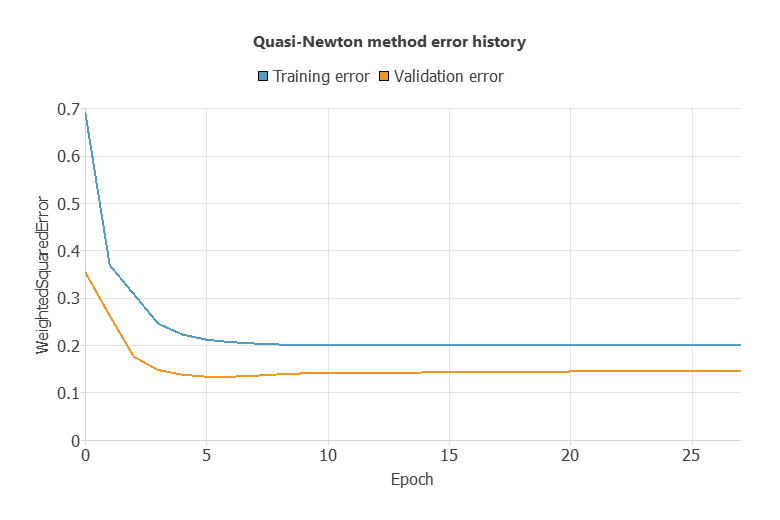
The model minimizes weighted squared error with the quasi-Newton method and L2 regularization weight 0.01. To counter the 270-to-39 class imbalance, the stored project assigns weight 3.9615 to negative records and 0.5722 to positive records.
Across 28 stored iterations (epochs 0–27), training error falls from 0.6908 to 0.2006 and selection error from 0.3544 to 0.1447. Optimization stops on minimum loss decrease.
5. Model selection and baseline
No neuron selection, input selection or architecture selection was performed. The direct 15–1 classifier is both the initial and final model. Given the small, duplicated table, adding hidden neurons would increase capacity without repairing the primary evidence limitations.
| Reference | Testing accuracy | Testing specificity | Interpretation |
|---|---|---|---|
| Majority-class baseline | 88.5% | 0% | Predict every row as yes |
| Fixed weighted classifier | 91.8% | 85.7% | Separates six of seven negative labels at score 0.50 |
The baseline comparison shows why accuracy is secondary here: a trivial classifier already reaches 88.5% because negative labels are rare.
6. Clinical validation
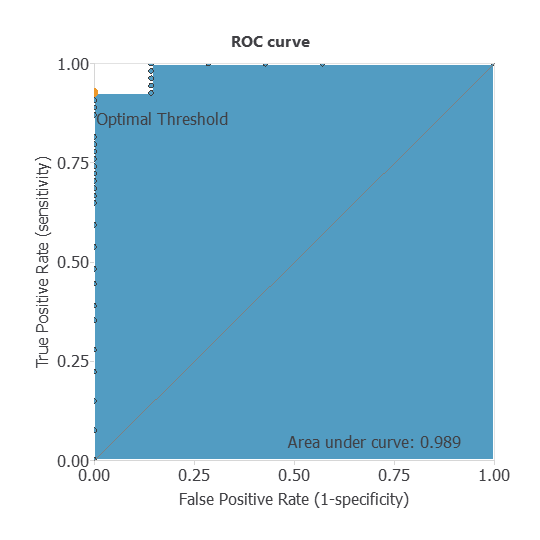
The final model is evaluated on 61 testing records containing 54 positive labels (88.5% observed test prevalence) and seven negative labels. Neural Designer reports ROC AUC 0.989 with a 95% confidence interval of 0.971–1.000.
Operating point at score 0.50
At threshold 0.50, the model produces 50 true positives, four false negatives, one false positive and six true negatives.
| Actual / predicted | Positive | Negative | Total |
|---|---|---|---|
| Positive label | 50 | 4 | 54 |
| Negative label | 1 | 6 | 7 |
| Total | 51 | 10 | 61 |
| Testing metric | Value | Count-based interpretation |
|---|---|---|
| Sensitivity | 92.6% | 50 of 54 positive labels detected |
| Specificity | 85.7% | 6 of 7 negative labels rejected |
| Precision / observed PPV | 98.0% | 50 of 51 positive calls match the source label |
| Observed NPV | 60.0% | 6 of 10 negative calls match the source label |
| Accuracy | 91.8% | 56 of 61 rows classified correctly |
| F1 score | 0.952 | Summary of precision and sensitivity |
| ROC AUC | 0.989 | 95% CI 0.971–1.000 |
7. Workflow and reproducibility
A responsible use of this artifact is a reproducibility workflow, not patient screening:
The calculator reproduces one complete record with the exact exported coefficients. It does not issue a screening decision or clinical classification.
Reproduce the exported survey score
The default row is the reference case generated in Neural Designer. The calculation runs locally with the exact exported scaling and coefficients.
Reproduce the calculation
The Python package contains the exact export, input order and reference vector. The Neural Designer package preserves the split, parameters and regenerated analyses.
from model import NeuralNetwork
inputs = [1, 62, 1, 0, 1, 0, 0, 1, 0, 1, 1, 1, 1, 0, 1]
score = NeuralNetwork().calculate_outputs(inputs)[0]8. Safety, generalizability and governance
- Unknown reference standard. The public table does not document how the cancer label was established or when predictors were collected relative to diagnosis.
- Not a screening cohort. The 87.4% positive proportion is incompatible with population-screening prevalence and makes PPV/NPV non-transferable.
- Duplicate leakage. Exact records cross training, selection and testing subsets; results must be repeated with duplicate groups kept together.
- Tiny negative test group. Specificity is based on only seven negative records, so one error changes it by 14.3 percentage points.
- No external validation. There is no independent site, temporal cohort, prospective evaluation or documented subgroup analysis.
- Uncalibrated score. No calibration curve, Brier score or recalibration study supports individual probability language.
- Incomplete screening variables. The table lacks pack-years, years since quitting and CT findings used in real screening pathways.
- Human expert review. Any consequential assessment requires an approved clinical pathway, qualified professionals and an appropriate confirmatory method.
References
- Kaggle: Survey Lung Cancer. Public redistribution page for the 309-row table; primary collection metadata are not supplied.
- US Centers for Disease Control and Prevention: Screening for Lung Cancer. The recommended screening test is low-dose CT.
- US Preventive Services Task Force: Lung Cancer Screening Recommendation Statement.