1. Introduction
Predictive maintenance uses data analysis and machine learning techniques to identify potential equipment failures before they occur.
It involves collecting and analyzing data from equipment and systems to predict when maintenance will be required and to take action to prevent equipment failure and downtime.
For instance, Auto-Associative Neural Networks (AANNs) are a powerful tool that we can use to identify abnormal states in data and help us with predictive maintenance.
Predictive maintenance is essential for several reasons, including:
- Reduced downtime: Predictive maintenance can identify and address potential issues before they become critical failures. This helps avoid unexpected downtime.
- Increased safety: Predictive maintenance can prevent accidents and injuries caused by malfunctioning equipment.
- Cost savings: Predictive maintenance can prevent minor problems from becoming significant failures, which can be costly to repair.
- Better asset management: Predictive maintenance can help organizations make informed decisions about maintenance schedules, replacement timelines, and asset retirement.
- Improved equipment life: Predictive maintenance can help prevent premature equipment failure.
Predictive maintenance is a complex problem that requires analyzing vast amounts of data from different sources, including equipment sensors, maintenance records, and other relevant factors such as environmental conditions and operating parameters.
However, more than historical data is needed to capture the full range of factors that influence equipment performance, making it difficult to build accurate predictive models.
Traditional statistical and machine learning techniques may need to be more effective in identifying patterns and predicting failures in complex systems.
Unlike conventional statistical models, which rely on historical data, Auto-Associative Neural Networks (AANNs) can learn underlying patterns and structures and use that information to detect significant deviations from what is considered “normal.”
To sum up, anomaly detection involves identifying rare or unexpected events in data that deviate significantly from what we consider normal.
Contents
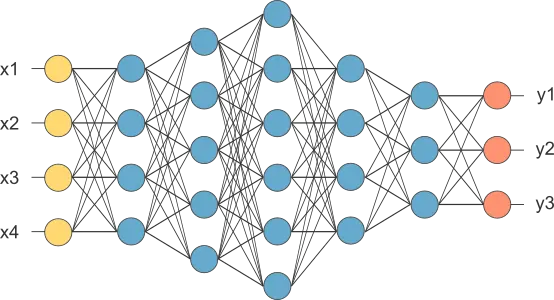
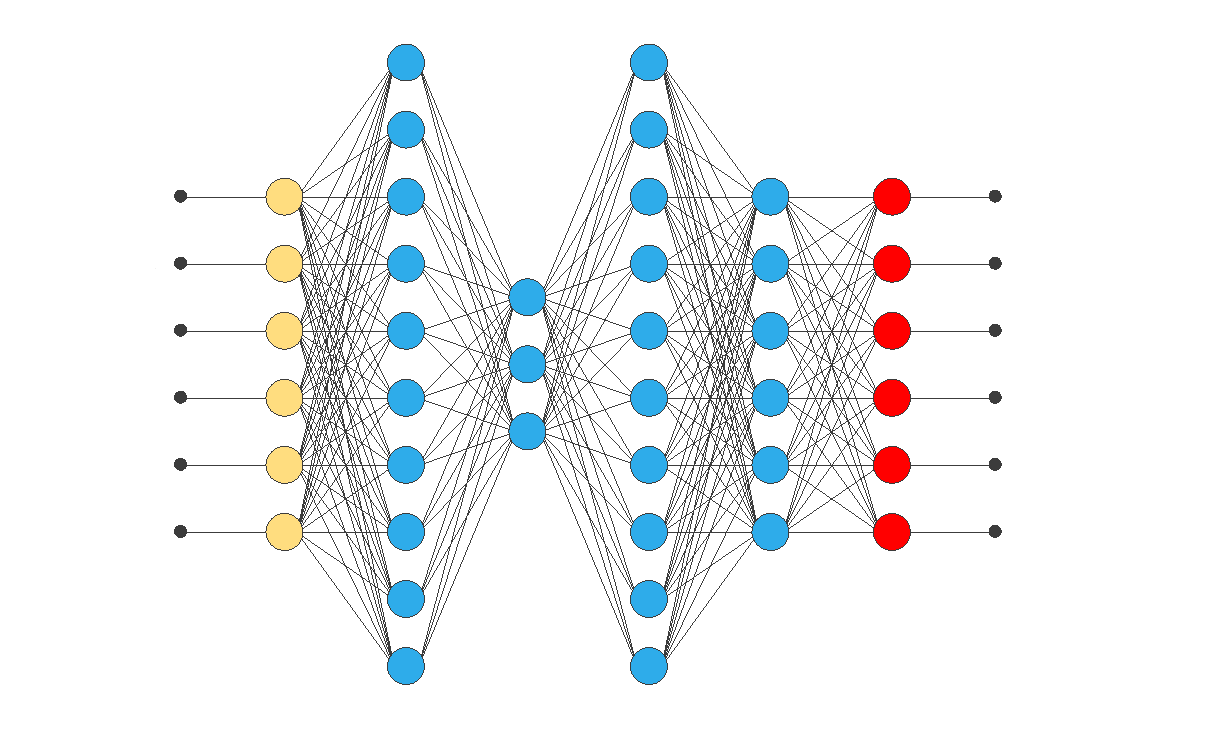
2. Architecture
The architecture of this network consists of several layers: the input layer, the mapping layer, the bottleneck layer, and the decoding or de-mapping layer.
Input layer
It is the first layer of the network and is responsible for receiving incoming data.
Each neuron in this layer represents a variable or characteristic in the input data set.
The activation function used in this layer depends on the data type being used.
For example, the linear activation function is usually used for numerical data.
Mapping layer
It is the second layer of the network.
Specifically, this layer maps the input data to a latent representation in a new dimension.
Moreover, each neuron in this layer receives inputs from all neurons in the input layer and, consequently, emits a unique output that represents a linear combination of the inputs received.
Furthermore, the activation function used in this layer is usually nonlinear, such as the sigmoid function or the ReLU function.
Bottleneck layer
It is the third layer of the network and is responsible for reducing the dimensionality of the representation.
This layer has fewer neurons than the input and mapping layers.
Therefore, it acts as a bottleneck that forces the network to learn a more compact representation of the data.
The activation function used in this layer is usually the linear function, regardless of the data used.
Decoding layer
After passing through the bottleneck layer, the representation propagates to the decoding layer, a reverse copy of the mapping layer.
The decoding layer is responsible for reconstructing the original input from the representation.
Therefore, the activation function used in this layer must be the same as in the mapping layer.
In summary, the input layer receives the input data, the mapping layer learns a latent representation of the data, the bottleneck layer reduces the dimensionality of the latent representation, and the decoding layer reconstructs the original input from the latent representation.
3. Training
Using auto-associative neural networks (AANNs) for anomaly detection in predictive maintenance starts with training the network on a “normal” data set, representing the typical or expected behavior.
The network then learns to compress this data into a lower-dimensional representation that captures the essential features of the data.
The network’s hidden layer, which contains this compressed representation, is then used to reconstruct the original data.
However, strange patterns in the input data will not fit well with the compact representation learned by the network.
Therefore, if the network is used to reconstruct the anomalous input data, the reconstructed output will significantly differ from the original.
This difference between the original and rebuilt data can be quantified using a measure of distance or error, such as Mean Squared Error (MSE):
[
begin{eqnarray}
text{MSE} = frac{1}{n} sum_{i = 1}^{n} left( y_i – tilde{y}_{i} right)^2
end{eqnarray}
]
Or Euclidean distance:
[
begin{eqnarray}
d(x,y) = sqrt{sum_{i = 1}^{n} left| y_i – x_i right|^2 }
end{eqnarray}
]
Once we have trained the model, the distances between the encoded input data and the original input data are saved. Then, we can use these distances during deployment.

A threshold for acceptable error is defined for the normal data. Any new data that results in a reconstruction error exceeding the established threshold will be identified as abnormal.
4. Deployment
The deployment stage involves passing new data through the trained model, encoding it into a new representation, and comparing the distances between the encoded input data and the original input data to determine whether it is within an acceptable range.

If the distance exceeds the established threshold, the input data is considered abnormal, and further investigation may be required.
The deployment process also involves monitoring the model’s performance over time and making necessary updates and adjustments to ensure that it continues to make accurate predictions on new data.
5. Other use cases
Auto-associative Neural Networks (AANNs) aren’t used only for predictive maintenance; they have a wide range of applications in various industries.
- Cybersecurity: They can be used to detect anomalous patterns in network traffic and identify potential security breaches.
- Healthcare: They can be used to detect anomalous patient behavior, such as irregular heartbeats or abnormal medical readings.
- Finance: They can be used for fraud detection, identifying unusual patterns in financial transactions, and flagging them for further investigation.
These networks’ potential uses are vast and varied, making them valuable tools.
6. References
- Hinton, G. E., & Salakhutdinov, R. R. (2006). Reducing the dimensionality of data with neural networks. Science 313(5786), 504-507.