Analyse five-year breast cancer survival from clinical and molecular data
This fixed-horizon survival analysis asks whether the recorded outcome occurs within five years. It combines clinical, treatment, gene-expression and mutation variables and implements the survival endpoint as binary classification. After growing-input selection, the final 95-feature sigmoid classifier reaches ROC AUC 0.746 on 351 held-out rows.
1. Scientific objective
The scientific objective is five-year overall-survival analysis. For each eligible row, the prepared target overall_mortality indicates whether death was recorded within the five-year horizon: label 1 is the event class and label 0 is five-year survival. Neural Designer therefore solves a fixed-horizon survival classification problem. Unlike a time-to-event model, it estimates one endpoint at five years and does not produce a complete survival or hazard curve.
Method development
Explore mixed clinical, categorical, transcriptomic and mutation inputs in one reproducible classification pipeline.
Five-year stratification
Quantify how well the model separates the recorded five-year mortality and survival classes in a held-out subset.
Reproducible review
Export the trained calculation and its exact 76-to-95 feature encoding for retrospective batch analysis.
2. Data and provenance
The prepared table contains 1,880 rows and 689 columns: one local identifier, 687 candidate predictors and the target. The predictors comprise 25 clinical/treatment descriptors, 489 gene-expression measurements and 173 mutation indicators. The target is observed for 1,755 rows; 125 rows labelled NA are unused.
| Subset | Rows | Positive labels | Purpose |
|---|---|---|---|
| Training | 1,053 | Stored in project | Estimate model parameters |
| Selection | 351 | Stored in project | Select the input subset and monitor training |
| Testing | 351 | 67 | Final internal evaluation |
| Unused | 125 | Target unavailable | Excluded from modelling |
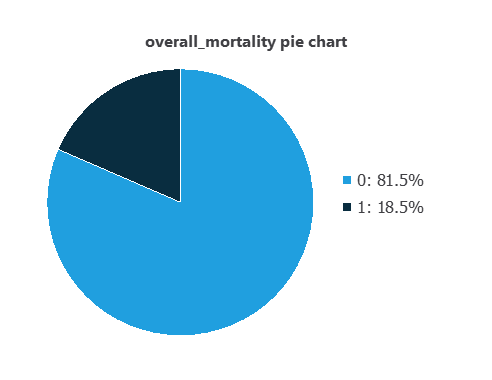
Among the 1,755 eligible rows, 325 (18.5%) carry the five-year mortality label and 1,430 (81.5%) carry the five-year survival label. This imbalance makes raw accuracy a poor headline metric.
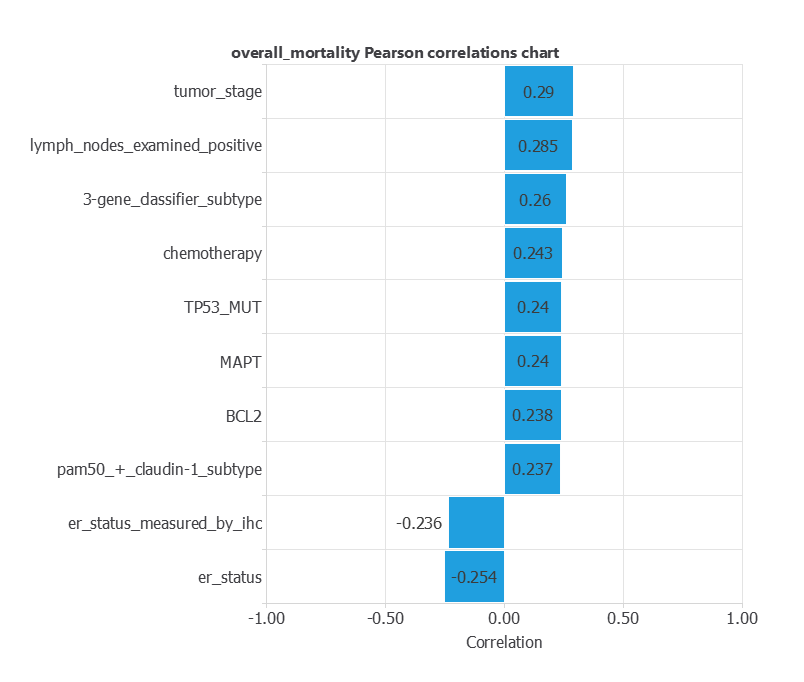
Predictor groups
| Group | Examples | Important timing question |
|---|---|---|
| Clinical and tumour | age_at_diagnosis, stage, size, receptor status, positive nodes | Available at or shortly after diagnosis? |
| Treatment | Surgery type, chemotherapy, hormone therapy, radiotherapy | Assigned before the intended prediction time? |
| Molecular | 489 expression measurements and 173 mutation indicators | Assay platform and preprocessing compatible? |
3. Model
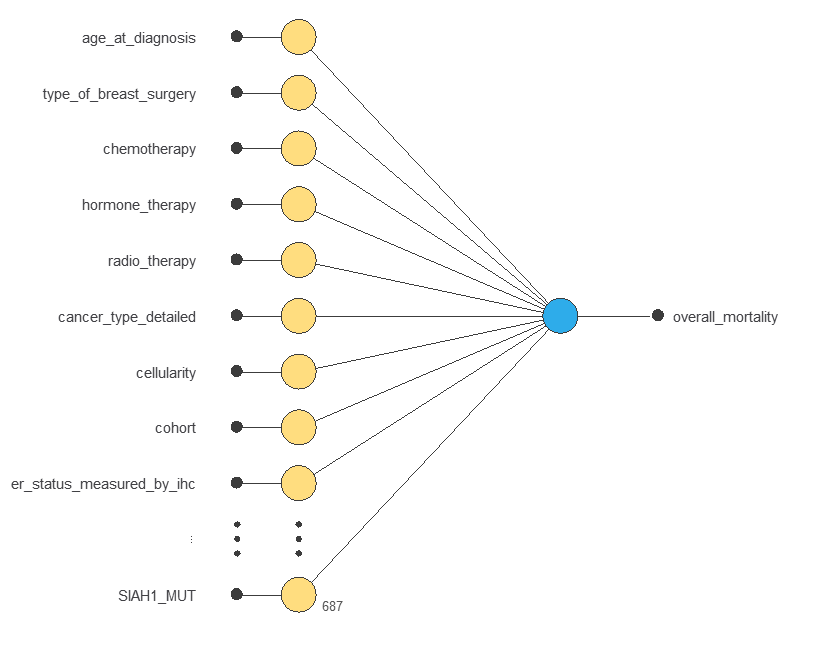
The initial model uses all 687 raw candidate predictors. Categorical expansion produces 722 numeric inputs, followed by scaling and one sigmoid output. With no hidden layer, this is a linear, logistic-like classifier with 723 trainable parameters—not a deep network.
4. Training strategy
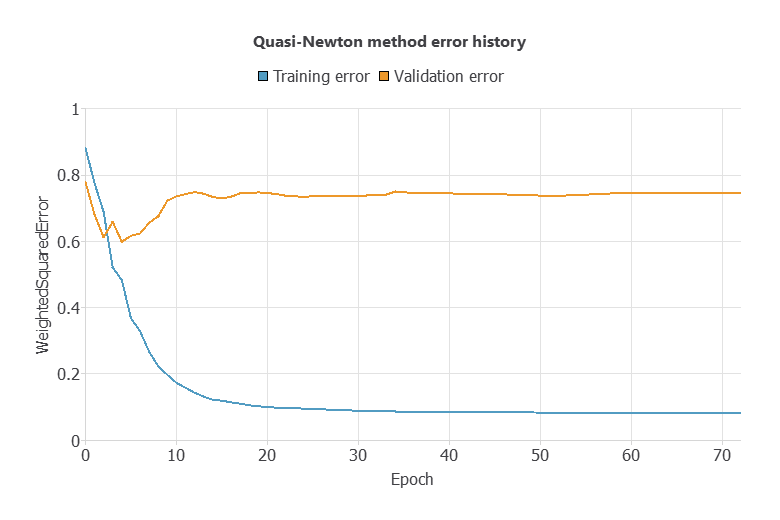
The first direct classifier is optimized with the quasi-Newton method using weighted squared error. Training error falls from 0.8825 to 0.0818 across 72 epochs, while selection error reaches its minimum early and ends at 0.7460. The widening gap is clear evidence of overfitting.
5. Model selection and baseline
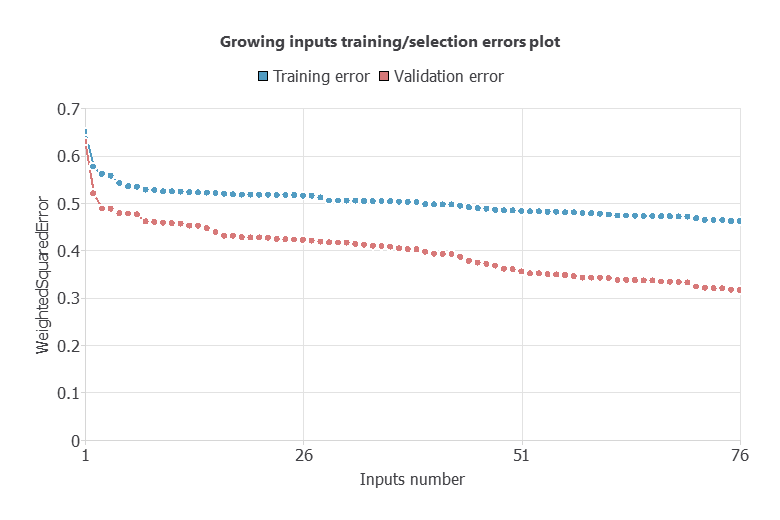
This project performs input selection, not neuron selection. A growing-input search adds variables according to selection performance and reaches its lowest stored selection error with 76 raw variables.
Final model
The 76 selected raw variables expand to 95 numeric inputs: 19 clinical/categorical indicators, 63 gene-expression measurements and three mutation indicators. The final 95-to-1 sigmoid classifier contains 96 trainable parameters.
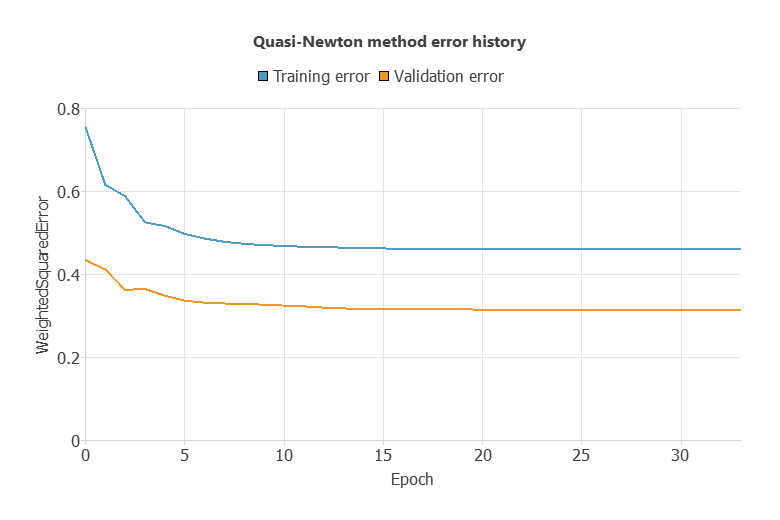
Retraining the reduced model for 33 epochs lowers training weighted squared error from 0.7571 to 0.4609 and selection error from 0.4354 to 0.3151.
6. Scientific validation
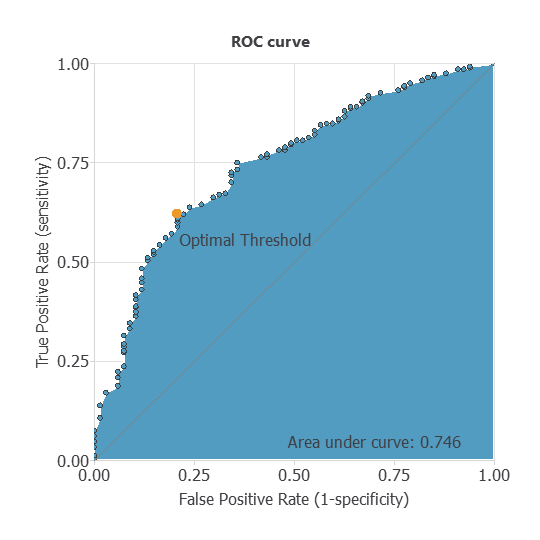
The final model is evaluated on the 351 testing rows only after training and input selection. Neural Designer reports ROC AUC 0.746 with a 95% confidence interval of 0.685–0.806. This indicates moderate internal discrimination with substantial uncertainty.
| Actual / predicted at 0.50 | Label 1 | Label 0 | Total |
|---|---|---|---|
| Actual label 1 | 44 | 23 | 67 |
| Actual label 0 | 85 | 199 | 284 |
| Total | 129 | 222 | 351 |
| Testing metric | Value | Professional reading |
|---|---|---|
| Sensitivity | 65.7% | 44 of 67 positive labels detected |
| Specificity | 70.1% | 199 of 284 negative labels rejected |
| Precision | 34.1% | 44 of 129 positive calls match label 1 |
| F1 score | 0.449 | Limited balance of precision and sensitivity |
| Balanced accuracy | 67.9% | More informative here than raw accuracy |
| Raw accuracy | 69.2% | Below the 80.9% majority-label baseline |
7. Inference and reproducibility
The defensible deployment is a versioned retrospective five-year survival-stratification workflow. It can assign model scores to a research cohort, compare operating thresholds and identify groups for aggregate survival research. A patient-facing calculator would hide the 76-field data contract, assay dependencies and missing-value policy.
Illustrative threshold scenarios
The following values are recalculated with the exported model on the same 351 testing rows. They show how the chosen score threshold changes detection of the five-year mortality class; they are not treatment thresholds.
| Retrospective policy | Threshold | Sensitivity | Specificity | False negatives | False positives | Possible research purpose |
|---|---|---|---|---|---|---|
| Sensitivity-first review | 0.30 | 88.1% | 48.2% | 8 | 147 | Reduce missed labelled cases at the cost of extensive review |
| Nearest ROC corner | 0.43 | 79.1% | 62.0% | 14 | 108 | Best internal sensitivity/specificity balance on this curve |
| Specificity-first review | 0.70 | 43.3% | 84.5% | 38 | 44 | Fewer false flags, with many more missed positives |
Run the final model in Python
The package includes the executable 95-input model, ordered schema, raw-row encoder and batch scorer. It does not include patient-level data.
python score_csv.py 5_years_mortality.csv scored_rows.csv --threshold 0.50Reproduce the calculation
The encoder applies the selected categorical expansion and stored mean replacement for missing numeric or binary values. The downloadable dataset retains all candidate predictors, while the package selects the final 76 raw fields in the required order.
8. Validity, uncertainty and limitations
- Fixed-horizon endpoint documentation. The example is a valid binary survival formulation only if every label 0 row was known to survive beyond five years. Survival time, vital-status timing and censoring are not retained in the derivative table, so that rule cannot be rechecked here.
- Prediction time is undefined. Surgery type and systemic treatment variables are retained in the final model. Their availability and meaning depend on whether the intended prediction occurs at diagnosis, after surgery or after treatment assignment.
- Random internal split only. The 1,053/351/351 partition samples one derived cohort; there is no temporal, geographic or external-centre evaluation.
- Input selection is optimistic unless nested. The same selection subset guides the 76-variable search. Stability across repeated grouped resampling is not reported.
- No calibration evidence. AUC measures ranking, not agreement between scores and five-year event frequencies. Calibration-in-the-large, slope, plots and recalibration are missing.
- High-dimensional assay dependence. Gene-expression normalization, platform effects, batch correction, mutation calling and missingness must match the development pipeline.
- Fixed-horizon simplification. The binary endpoint answers one five-year question but discards when the event occurred, survival beyond that horizon, cause of death and competing risks. Historical treatments may also differ from current practice.
- Subgroup performance is untested. Aggregate discrimination does not establish comparable performance across age, receptor status, stage, molecular subtype, cohort or demographic groups.
- No clinical-utility evaluation. There is no comparison with established prognostic models, decision-curve analysis, prospective workflow study or evidence of improved patient outcomes.
From fixed-horizon to full survival modelling
The present classifier is appropriate for demonstrating a single five-year endpoint. A more complete study would define the index date, retain event and censoring times, compare the classifier with a time-to-event survival model, freeze predictors to those available at the index date, assess calibration and clinical net benefit, and perform temporal plus external-centre validation under TRIPOD+AI and PROBAST+AI.
References
- Curtis C, Shah SP, Chin SF, et al. The genomic and transcriptomic architecture of 2,000 breast tumours reveals novel subgroups. Nature. 2012;486:346–352.
- Pereira B, Chin SF, Rueda OM, et al. The somatic mutation profiles of 2,433 breast cancers refine their genomic and transcriptomic landscapes. Nature Communications. 2016;7:11479.
- Breast Cancer METABRIC study. cBioPortal for Cancer Genomics.
- Collins GS, Moons KGM, Dhiman P, et al. TRIPOD+AI statement. BMJ. 2024;385:e078378.
- Moons KGM, Damen JAAG, Kaul T, et al. PROBAST+AI. BMJ. 2025;388:e082505.
- NEMHESYS — NGS Establishment in Multidisciplinary Healthcare Education System supported the original educational application.