Screen 28-day concrete strength before committing to laboratory trials
This surrogate model estimates 28-day compressive strength from seven constituent quantities. It helps concrete technologists compare candidate mixtures and focus physical testing on the most promising, feasible formulations.42528-day laboratory specimens
7mixture-component inputs
85independent testing rows
4.88 MPatesting MAE
Compressive-strength testing is essential, but each result arrives only after batching, curing, and destructive laboratory testing. A data-driven surrogate can provide rapid estimates for screening and scenario analysis, while qualified mix design, trial batches and standards-based testing remain the basis for production and structural decisions.
1. Industrial challenge
This is an approximation problem: the model maps seven constituent quantities to the continuous targetcompressive_strength, measured in MPa after 28 days.Screen candidate mixturesEstimate whether a formulation is likely to approach the required strength before scheduling a complete trial.
Study material trade-offs: Explore how cement, supplementary cementitious materials, water, admixture, and aggregates jointly affect the response.
Prioritize laboratory workUse predictions to rank feasible candidates while retaining physical testing for verification and acceptance.
Concrete technologyReady-mix productionPrecast manufacturingMaterials laboratoriesQuality assuranceSustainable construction
Model role. This is a 28-day strength-screening surrogate. It supports engineering exploration but does not issue an approved mix design, verify code compliance, or replace batch trials and destructive tests.
2. Data set
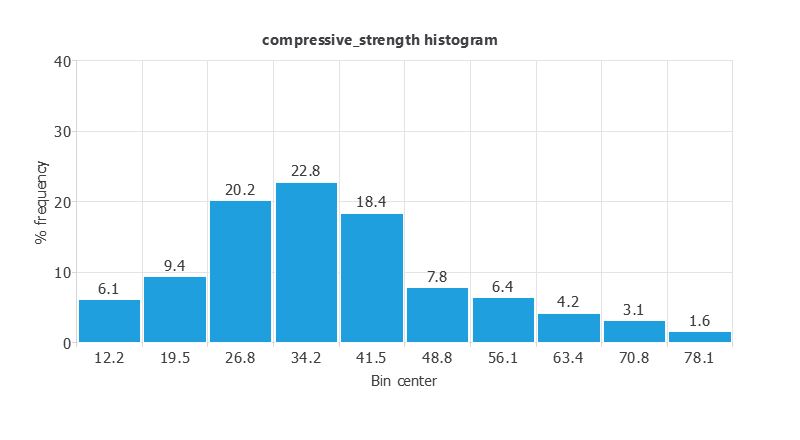
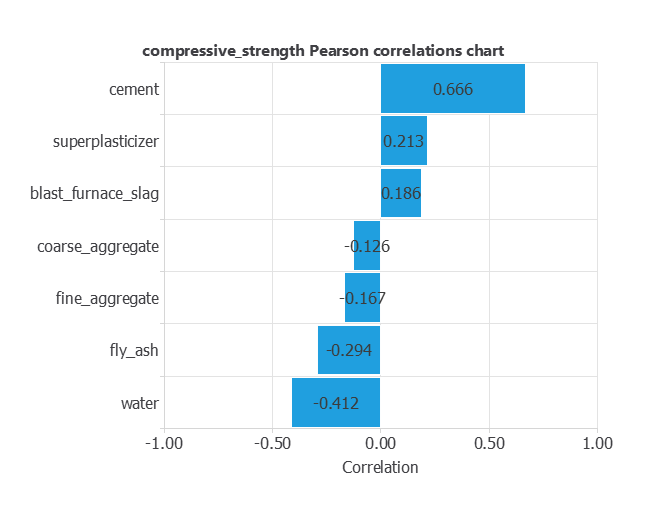
The source UCI Concrete Compressive Strength dataset contains 1,030 laboratory results with age as an input. This example uses all 425 records tested at 28 days, so age is fixed and omitted from the local file. The semicolon-delimited CSV contains seven numerical inputs, one numerical target, and no missing values.| CSV variable | Engineering meaning | Role | Unit | Observed range |
|---|---|---|---|---|
cement | Cement | Input | kg/m³ | 102 to 540 |
blast_furnace_slag | Blast-furnace slag | Input | kg/m³ | 0 to 359.4 |
fly_ash | Fly ash | Input | kg/m³ | 0 to 200.1 |
water | Water | Input | kg/m³ | 121.8 to 247 |
superplasticizer | Superplasticizer | Input | kg/m³ | 0 to 32.2 |
coarse_aggregate | Coarse aggregate | Input | kg/m³ | 801 to 1145 |
fine_aggregate | Fine aggregate | Input | kg/m³ | 594 to 992.6 |
compressive_strength | 28-day compressive strength | Target | MPa | 8.54 to 81.75 |
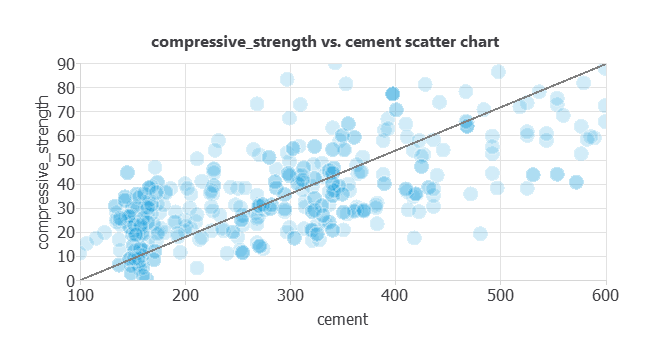
Validation note. The split is random. The file contains 416 unique input formulations and five duplicated formulation groups; two duplicate groups cross subset boundaries. A stronger evaluation should group identical or related mixtures so that one formulation cannot contribute rows to both model development and testing.
3. Neural network
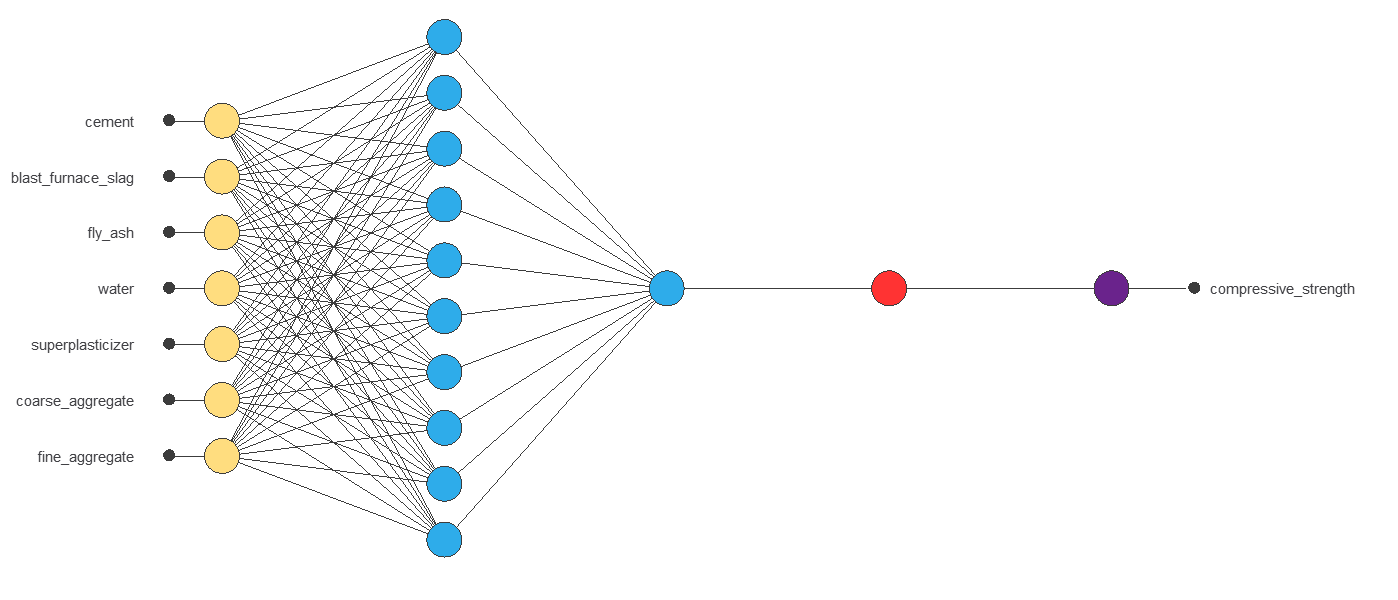
The initial model standardizes seven inputs using mean and standard deviation, evaluates three tanh hidden neurons and returns one linear strength estimate before unscaling to MPa. The initial 7–3–1 architecture contains 28 trainable parameters.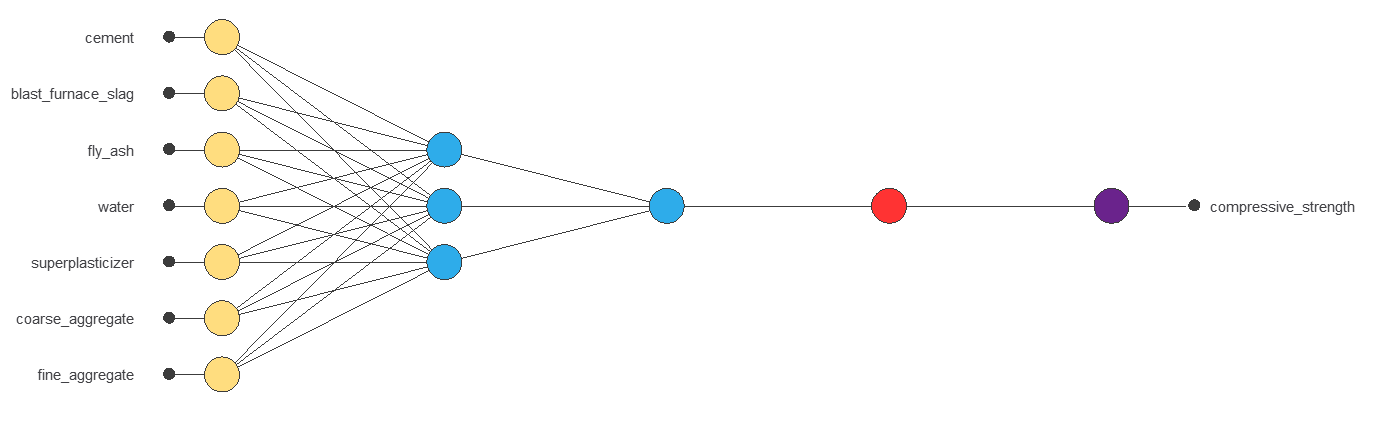 The initial network provides a compact starting point. Model selection then changes the hidden-layer size; Section 5 shows the final testing and deployment model.
4. Training strategy
The initial network minimizes normalized squared error with L2 regularization weight 0.01 using the quasi-Newton method. Optimization stops after 78 epochs because it reaches the minimum loss decrease criterion. The recorded training and selection errors are 0.098 NSE and 0.049 NSE.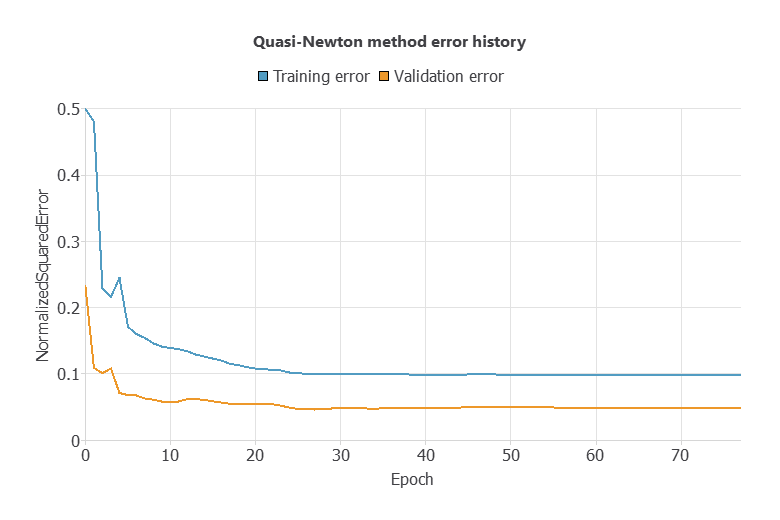
5. Model selection
The growing-neurons task compares hidden-layer sizes from 1 to 10, using three trials per size. The smallest recorded selection error, 0.042 NSE, occurs at 10 neurons; the corresponding training error is 0.083 NSE.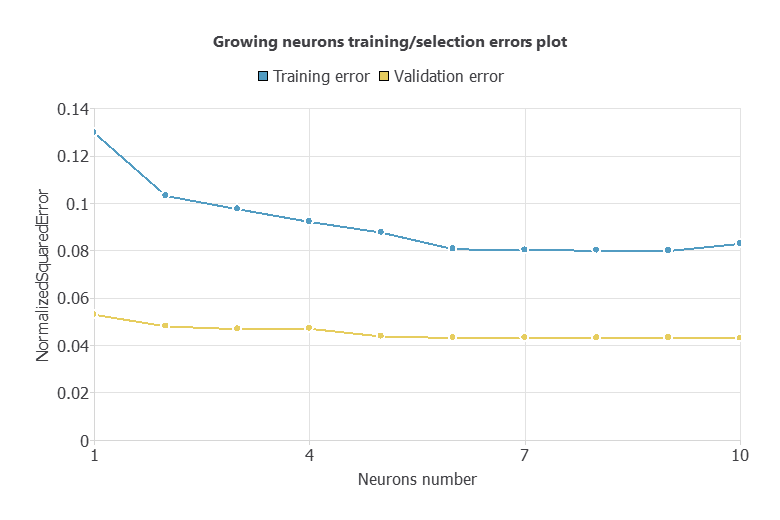
6. Testing analysis
We recalculated the exported final model on the 85 rows marked as testing. R² is the squared correlation reported by the Neural Designer goodness-of-fit analysis; MAE and RMSE express errors directly in MPa.| Testing rows | R² | MAE | RMSE | Bias | 95th-percentile absolute error | Maximum absolute error |
|---|---|---|---|---|---|---|
| 85 | 0.8214 | 4.88 MPa | 6.06 MPa | +0.68 MPa | 10.70 MPa | 19.34 MPa |
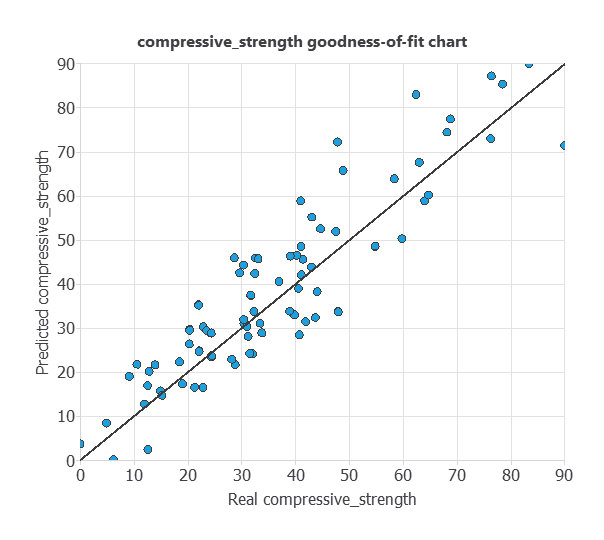
Example testing specimen. Row 421 contains 276.4 kg/m³ cement, 116.0 kg/m³ slag, 90.3 kg/m³ fly ash, 179.6 kg/m³ water, 8.9 kg/m³ superplasticizer, 870.1 kg/m³ coarse aggregate, and 768.3 kg/m³ fine aggregate. The measured strength is 44.28 MPa, and the model predicts 44.74 MPa, an absolute error of 0.46 MPa.
7. Model deployment
A practical workflow starts with a physically feasible formulation and ends with laboratory confirmation. The model can screen or rank candidates, but apply engineering constraints before inference, and do not use predictions as production specifications without validation.Candidate formulation and material data
Range, mass-balance and feasibility checks
28-day strength surrogate
Trial batch, testing and engineering approval
Optimization case 1: reduce cement for a 45 MPa requirement
Operational question: what is the lowest-cement candidate that provides a modeled safety margin above a required 28-day strength of 45 MPa? The executed task minimizes cement, keeps the other constituents inside defined operating intervals, and requires a predicted strength of at least 55 MPa. The additional 10 MPa is an illustrative screening margin informed by the model error; it is not a certified characteristic-strength calculation or prediction interval.| Variable | Condition | Lower bound | Upper bound | Optimized value | Unit |
|---|---|---|---|---|---|
| Cement | Minimize | — | — | 126.513 | kg/m³ |
| Blast-furnace slag | Between | 50 | 220 | 219.710 | kg/m³ |
| Fly ash | Between | 0 | 150 | 139.026 | kg/m³ |
| Water | Between | 160 | 195 | 172.402 | kg/m³ |
| Superplasticizer | Between | 0 | 15 | 14.277 | kg/m³ |
| Coarse aggregate | Between | 850 | 1,075 | 1,060.860 | kg/m³ |
| Fine aggregate | Between | 650 | 875 | 869.364 | kg/m³ |
| Compressive strength | ≥ | 55 | — | 55.000 | MPa |
Result and engineering interpretation
| Check | Candidate | Observed data domain | Assessment |
|---|---|---|---|
| Total binder | 485.249 kg/m³ | 200.0–640.0 kg/m³ | Inside observed interval |
| Water-to-binder ratio | 0.355 | 0.235–0.900 | Inside observed interval |
| Total constituent mass | 2,602.152 kg/m³ | 2,194.6–2,551.0 kg/m³ | 51.2 kg/m³ above observed maximum |
Optimization case 2: maximize strength with cement capped at 300 kg/m³
Operational question: what is the highest 28-day strength predicted inside the declared constituent limits when cement cannot exceed 300 kg/m³? This scenario maximizes the model output while bounding cement and every other constituent. It represents a producer seeking higher strength without moving to a high-cement formulation.| Variable | Condition | Lower bound | Upper bound | Optimized value | Unit |
|---|---|---|---|---|---|
| Cement | Between | 200 | 300 | 299.998 | kg/m³ |
| Blast-furnace slag | Between | 0 | 220 | 220.000 | kg/m³ |
| Fly ash | Between | 0 | 150 | 149.499 | kg/m³ |
| Water | Between | 155 | 190 | 178.930 | kg/m³ |
| Superplasticizer | Between | 0 | 15 | 13.390 | kg/m³ |
| Coarse aggregate | Between | 850 | 1,075 | 1,075.000 | kg/m³ |
| Fine aggregate | Between | 650 | 875 | 874.735 | kg/m³ |
| Compressive strength | Maximize | — | — | 80.156 | MPa |
Result and engineering interpretation
| Check | Candidate | Observed data domain | Assessment |
|---|---|---|---|
| Total binder | 669.497 kg/m³ | 200.0–640.0 kg/m³ | 29.5 kg/m³ above observed maximum |
| Water-to-binder ratio | 0.267 | 0.235–0.900 | Inside observed interval |
| Total constituent mass | 2,811.552 kg/m³ | 2,194.6–2,551.0 kg/m³ | 260.6 kg/m³ above observed maximum |
Comparison of the two executed cases
| Scenario | Primary objective | Cement | Predicted strength | Total mass | Current status |
|---|---|---|---|---|---|
| Low-cement target-strength case | Minimize cement with predicted strength ≥55 MPa | 126.513 kg/m³ | 55.000 MPa | 2,602.152 kg/m³ | Promising objective; revise mass balance |
| Cement-capped maximum-strength case | Maximize strength with cement ≤300 kg/m³ | 299.998 kg/m³ | 80.156 MPa | 2,811.552 kg/m³ | Boundary result; reformulate constraints |
Decision rule. Response optimization identifies model-supported candidates, not approved concrete recipes. A candidate should advance only after joint-domain checks, mixture-volume and material-compatibility review, trial batching, curing, and standards-based strength testing.
Cement sensitivity at a reference formulation
At 265 kg/m³ cement, 86 kg/m³ slag, 62 kg/m³ fly ash, 183 kg/m³ water, 7 kg/m³ superplasticizer, 956 kg/m³ coarse aggregate and 764 kg/m³ fine aggregate, the model predicts 37.47 MPa. The directional plot varies cement while holding the other quantities fixed.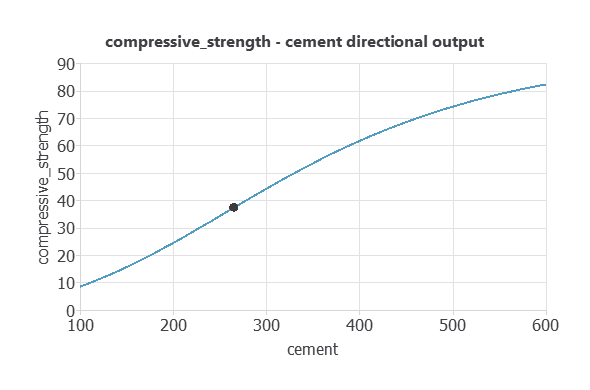
Try the 28-day strength model
Enter one mixture or load a verified example. The browser evaluates the exact scaling, weights, and output transformation from the exported Python model.Predicted 28-day compressive strength—Model estimate
Total constituent mass—Joint-domain check
Screening model — not a certified mix design, conformity assessment, or structural acceptance method.
Download and reproduce
Download Python model (ZIP)Download Neural Designer project + CSV (ZIP)Download concrete_properties.csv
Video walkthrough
The original tutorial remains available as a step-by-step Neural Designer walkthrough. Numerical results on this page reflect the newly exported project.8. Scope and limitations
- The model represents 28-day strength only. It cannot estimate early-age or long-term strength because age is fixed and not included in the inputs.
- The data comes from a public laboratory collection and does not establish transfer to a specific plant, cement source, aggregate grading, admixture product, curing regime, or test procedure.
- Random row splitting and duplicated formulations can produce a more optimistic test than validation by unseen formulation family, production batch or chronological campaign.
- The target is compressive strength only; the model does not capture workability, slump, density, durability, heat, shrinkage, cost, or embodied carbon.
- Inputs are constituent masses, but the model does not enforce volume balance, total yield, water-to-binder limits, aggregate proportions, or material compatibility.
- The observed range of each variable does not define a valid multidimensional mixture domain. Joint feasibility must be checked separately.
- Production deployment requires local data, grouped or time-aware validation, drift monitoring, uncertainty limits, and periodic recalibration.
- Predictions support screening and experimentation; qualified personnel and standards-based testing remain responsible for mix approval and structural acceptance.
References
- Yeh, I.-C. Concrete Compressive Strength Dataset, UCI Machine Learning Repository, DOI: 10.24432/C5PK67.
- Yeh, I.-C. Modeling of strength of high-performance concrete using artificial neural networks, Cement and Concrete Research 28(12), 1797–1808 (1998).
- Neural Designer testing analysis: goodness-of-fit and regression metrics.
- Neural Designer model deployment: directional outputs, response optimization and model export.