Introduction
Lung cancer is the leading cause of cancer-related deaths worldwide, and early detection is critical since symptoms often appear only at advanced stages.
Using data from 309 patients (16 variables covering lifestyle, symptoms, and medical history), we trained a neural network to estimate lung cancer risk.
The model achieved high performance (AUC = 0.975, accuracy = 96.7%), showing potential as a clinical decision-support tool for prevention and early detection.
Healthcare professionals can test this methodology by downloading Neural Designer.
Contents
The following index outlines the steps for performing the analysis.
1. Model type
- Problem type: Binary classification (presence or absence of lung cancer)
- Goal: Model the probability of lung cancer based on patient lifestyle factors, symptoms, and medical conditions to support clinical decision-making using artificial intelligence and machine learning.
2. Data set
Data source
The dataset lung-cancer.csv includes 309 rows (patients) and 16 columns (variables) for study participants and cancer risk factors.
Variables
The following list summarizes the variables’ information:
Patient characteristics
gender (1 = male, 2 = female) – Lung cancer may affect males and females differently.
age (years) – Lung cancer mainly occurs in older people.
Lifestyle factors
smoking (0 = no, 1 = yes) – Cigarette smoking is the number one risk factor for lung cancer.
alcohol_consuming (0 = no, 1 = yes) – Regular alcohol consumption may harm lung tissue.
peer_pressure (0 = no, 1 = yes) – Stress or social influence may be associated with lifestyle risk factors.
Symptoms and conditions
yellow_fingers (0 = no, 1 = yes) – Often linked to smoking; may also indicate other health issues.
anxiety (0 = no, 1 = yes) – Anxiety disorders can share symptoms with lung cancer (e.g., breathing difficulties).
chronic_disease (0 = no, 1 = yes) – Includes COPD, asthma, or other long-term lung conditions.
fatigue (0 = no, 1 = yes) – Early symptom often associated with respiratory problems.
allergy (0 = no, 1 = yes) – Some allergies share respiratory symptoms with lung cancer.
wheezing (0 = no, 1 = yes) – Whistling sound in breathing due to blocked or narrowed airways.
coughing (0 = no, 1 = yes) – A Persistent cough is a common symptom of lung cancer.
shortness_of_breath (0 = no, 1 = yes) – Also called dyspnea; difficulty in breathing.
swallowing_difficulty (0 = no, 1 = yes) – Dysphagia, often caused by tumor growth.
chest_pain (0 = no, 1 = yes) – Pain in the chest when breathing deeply, coughing, or laughing.
Target variable
lung_cancer (0 = no, 1 = yes) – Presence or absence of lung cancer.
Instances
The dataset’s instances are split into training (60%), validation (20%), and testing (20%) subsets by default.
You can adjust them as needed.
Variables distribution
We can examine variable distribution; the figure shows the number of patients with and without lung cancer in the dataset.
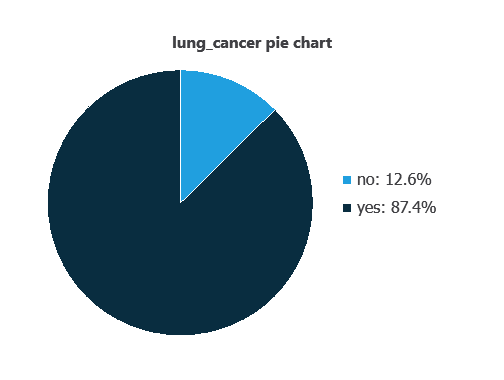
As depicted in the image, 87.4% of the patients have lung cancer, while approximately 12.6% do not.
Input-target correlations
The input-target correlations indicate which clinical and demographic factors most influence the presence or absence of lung cancer, and therefore are more relevant to our analysis.
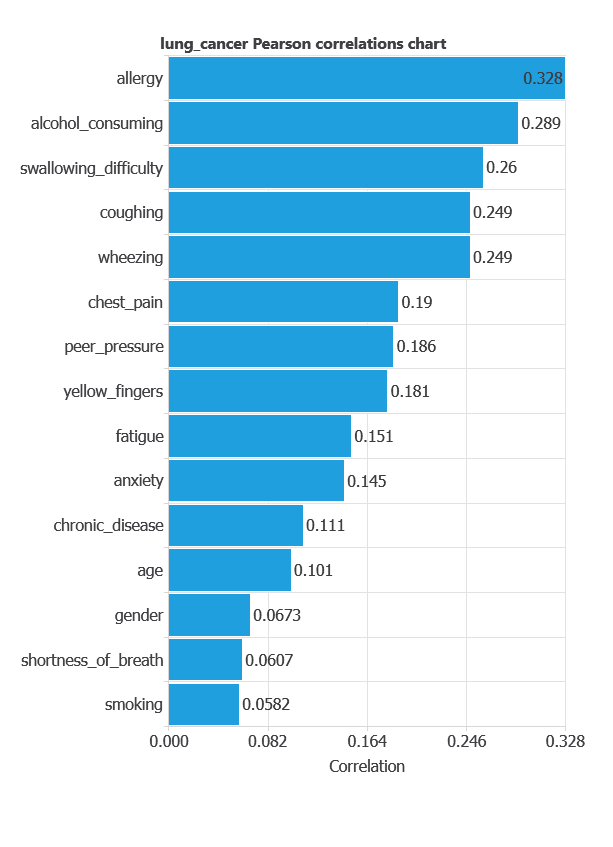
Here, the most correlated variables with malignant tumors are allergy, alcohol consuming, and swallowing difficulty.
3. Neural network
A neural network is an artificial intelligence model inspired by how the human brain processes information.
It is organized in layers: the input layer receives the variables, and the output layer provides the probability of belonging to a given class.
Trained with historical data, the network learns to recognize patterns and distinguish between categories, offering objective support for decision-making.
The network uses 15 diagnostic variables to output the probability of lung cancer, with connections showing each variable’s contribution.
4. Training strategy
Training a neural network uses a loss function and an optimization algorithm to learn from data while avoiding overfitting, ensuring good performance on both training and new cases.
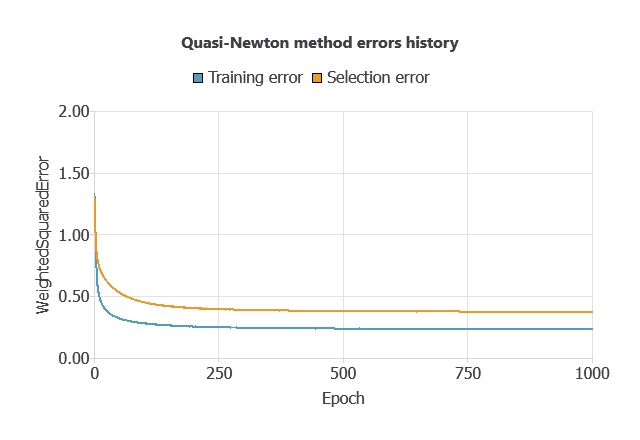
For the training and selection errors steadily decreased (MSE = 0.0503 and 0.0784), indicating the network learned effectively while avoiding overfitting, and it can generalize to new data.
5. Testing analysis
The trained neural network’s performance is evaluated by comparing its outputs with previously unseen testing instances.
ROC curve
In the case of the ROC curve is a standard tool to evaluate a classification model, showing how well it distinguishes between two classes by comparing predicted results with actual outcomes, such as patients with and without lung cancer.
A random classifier scores 0.5, while a perfect classifier scores 1.
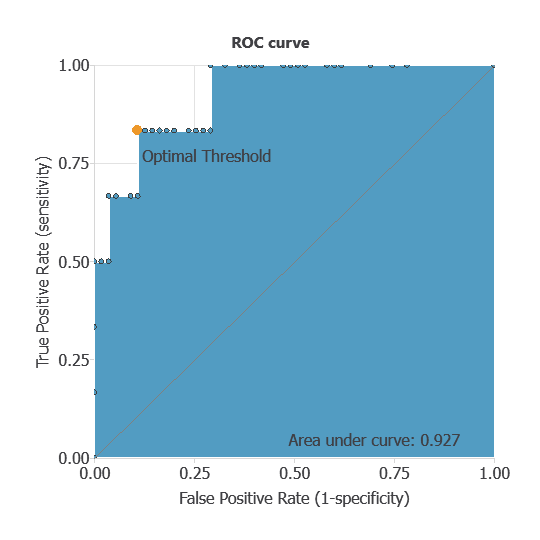
The AUC obtained is 0.927, showing that the model performs exceptionally well at distinguishing between benign and malignant tumors.
Confusion matrix
The confusion matrix shows the model’s performance by comparing predicted and actual diagnoses. It includes:
true positives – patients correctly identified as having lung cancer
false positives – patients incorrectly identified as having lung cancer
false negatives – patients with lung cancer incorrectly identified as healthy
true negatives – patients correctly identified as healthy
For a decision threshold of 0.5, the confusion matrix was:
| Predicted positive | Predicted negative | |
|---|---|---|
| Real positive | 53 | 1 |
| Real negative | 0 | 8 |
In this case, 98.5% of cases were correctly classified and 1.5% were misclassified.
Binary classification
Using a classification threshold of 0.975, the performance of this binary classification model is summarized with standard measures.
Accuracy: 98.5% of patients were correctly classified.
Error rate: 1.5% of cases were misclassified.
Sensitivity: 100% of patients with lung cancer were correctly identified.
Specificity: 98% of healthy patients were correctly identified.
These measures indicate that the model is highly effective at distinguishing between patients with and without lung cancer.
6. Model deployment
After confirming the neural network’s ability to generalize, the model can be saved for future use in deployment mode.
This allows the trained network to be applied to new patients, using their clinical variables to calculate the probability of lung cancer.
In deployment mode, healthcare professionals can use the model as a reliable diagnostic support tool for classifying new patients.
The Neural Designer software exports the trained model automatically, making it easy to integrate into clinical practice.
Conclusions
This lung cancer risk model, trained with 309 patients, achieved an AUC = 0.975 and 96.7% accuracy.
Its top predictors (smoking-related symptoms and lifestyle factors) align with clinical knowledge, reinforcing its reliability.
Future work could include validating the model on larger and more diverse populations to enhance its generalizability.
References
- Oliver, A. S., Jayasankar, T., Sekar, K. R., Devi, T. K., Shalini, R. et al. (2021). Early Detection of Lung Carcinoma Using Machine Learning. Intelligent Automation & Soft Computing, 30(3), 755-770.
- Dataset from: Kaggle: Lung Cancer.
- Dataset from: data.world: Survey Lung Cancer.