A Chinese automobile company aspires to enter the US market by setting up its manufacturing unit and producing cars locally to compete with its US and European counterparts. To support this objective, the company can use machine learning to build a model that helps understand pricing in the new market. Specifically, it wants to identify the factors affecting car prices in the American market. Indeed, those factors may differ significantly from those in the Chinese market. Additionally, the company aims to determine which variables significantly predict car prices and how well those variables explain pricing trends based on various market surveys.
In this context, performance optimization can be applied to better understand the behavior of the American car market.
For this purpose, we have gathered a large dataset of different types of cars across the American market.
Accordingly, we must model car prices using the available independent variables. The company’s management will use this model to understand how prices vary with those variables. Consequently, they can adjust the design of the cars, refine the business strategy, and align decisions with specific price targets. Furthermore, the model will provide management with a clearer understanding of the pricing dynamics in this new market.
Contents
This example is solved with Neural Designer. To follow it step by step, you can use the free trial.
1. Application type
This is an approximation project, since the variable to be predicted is continuous (car price). Therefore, the problem is addressed using regression techniques.
In this case, the fundamental goal is to model car pricing as a function of multiple features, including vehicle characteristics and different engine types. By doing so, the company can better understand how these factors influence price levels.
2. Data set
The first step is to prepare the data set, which is the source of information for the approximation problem. It is composed of:
- Data source.
- Variables.
- Instances.
Data source
The file car_price_assignment.csv contains the data for this example. Here the number of variables (columns) is 26, and the number of instances (rows) is 205.
Variables
In that way, this problem has the 25 following variables:
- car_id, unique ID of each observation.
- symboling, it is an insurance risk rating; a value of +3 indicates that the auto is risky, and -3 indicates that it is probably pretty safe.
- car_brand, brand of the car company.
- car_name, specific model of the car.
- fuel_type, car fuel type i.e., gas or diesel.
- aspiration, aspiration used in a car; “std” for standard and “turbo”.
- door_number, number of doors in a car.
- car_body, the body of a car could be: hardtop, wagon, sedan, hatchback and convertible.
- drive_wheel, type of drivewheel;”fwd” stands for front wheel drive, “4wd” stands for four wheel drive and “rwd” stands for rear wheel drive.
- engine_location, rear or front location of the car engine.
- wheel_base, is the distance between the front and rear wheels, in Inches.
- car_length, in Inches.
- car_width, in Inches.
- car_height, in Inches.
- curb_weight, weight of a car without occupants or baggage, in Libras.
- engine_type, “ohc” stands for Overhead Camshaft engines, “ohcv” stands for Overhead Valve engines, “ohc” stands for Overhead Camshaft engines, “ohcf”,”dohc” stands for Dual Overhead Camshaft engines, “l” for L engines, “dohcv” stands for Dual Overhead Valve engines and “rotor” .
- cylinder_number, number of cylinders.
- engine_size, in Cubic Centimetres.
- fuel_system, “mpfi” stands for Multi Point Fuel injection, “1ppl”, “2bbl”, “4bbl”, “idi”, “mfi”, “spdi”, “spfi”.
- bore_ratio, adimensional quantity calculated by the ratio between cylinder bore diameter and piston stroke length.
- stroke, the distance traveled by the piston during each cycle, in inches.
- compression_ratio, adimensional quantity calculated by the ratio between the volume of the cylinder and combustion chamber when the piston is at the bottom of its stroke, and the volume of the combustion chamber when the piston is at the top of its stroke.
- horse_power, in HorsePower.
- peak_rpm, in revolutions per minute.
- city_mpg, it shows how far your car can travel in the city for every gallon of gas, in miles per gallon.
- highway_mpg, it shows how far your car can travel on the highway for every gallon of gas, in miles per gallon.
- price, the final price in Dollars.
All the variables in the study are used as inputs, except for fuel_system, car_brand, and car_name, which remain marked as “unused.” In contrast, price is defined as the output variable that we aim to predict in this machine learning study.
Moreover, Neural Designer automatically excludes the first variable, car_id, from the total number of variables, since it does not provide meaningful information for modeling purposes.
After configuring the variables, we randomly divide the instances into training, selection, and testing subsets, containing 60%, 20%, and 20% of the data, respectively. More specifically, we use 123 samples for training, 41 for validation, and 41 for testing.
Data distribution
Once all the data set information has been set, we will perform some analytics to check the quality of the data.
For instance, we can calculate the data distribution. The next figure depicts the histogram for the target variable.
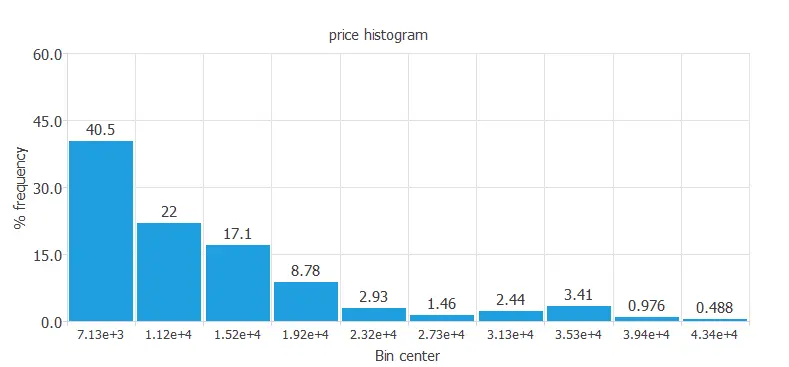
As we can see in the diagram, the car price has a normal distribution because we expect American customers to buy cars at a low-medium range of prices. However, only a few percent of the American population can buy expensive cars, as the median personal income of Americans is not extremely high.
Inputs-targets correlations
The next figure depicts the inputs-targets correlations. In particular, it helps us understand how each input variable influences the final price.
From this analysis, we observe that some variables show very weak correlations with the target. Therefore, to obtain more conclusive results, we can exclude poorly correlated variables. To do so, click on “Unuse uncorrelated variables” in the Task Manager window and set a minimum correlation threshold of 0.01, which is the lowest value allowed.
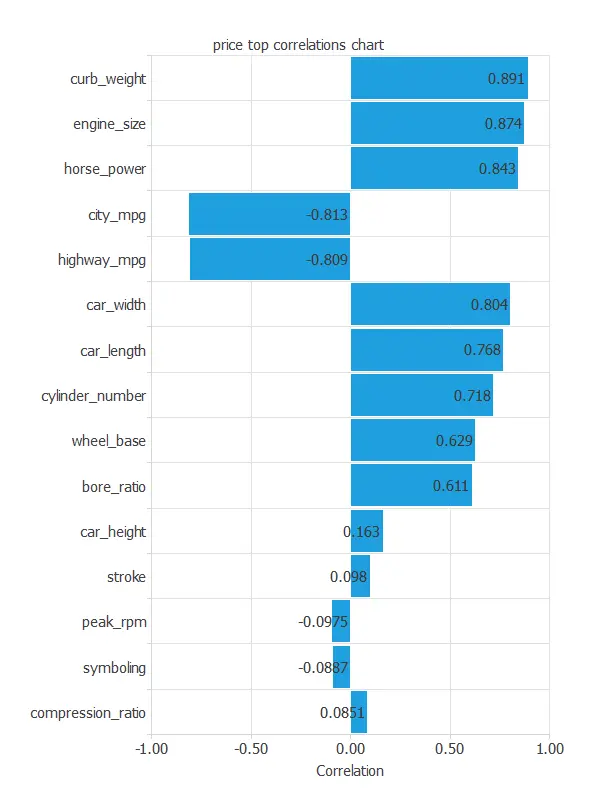
The above chart shows that a few instances have an important dependency on the car price. As we can see, curb weight, engine size, and horsepower positively affect the price; the bigger the engine size, the more expensive the car is. On the other hand, some instances (city and highway miles per gallon consumption) have an important negative dependency on the price. The less the car consumes, the higher the price is.
We can also plot a scatter chart with the price versus the horsepower.
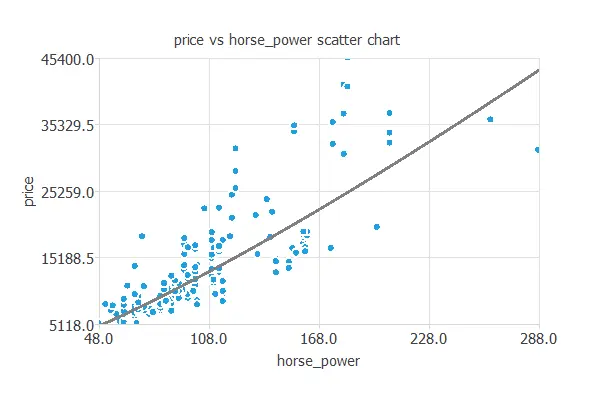
In general, the more horsepower, the higher the price. However, the price depends on all the inputs at the same time.
3. Neural network
The neural network outputs the car’s closing price as a function of the different features described previously. In other words, it models price based on the combined influence of all relevant car characteristics.
For this approximation example, the neural network consists of the following components:
Scaling layer
Perceptron layers
Unscaling layer
First, the scaling layer transforms the original inputs into normalized values. In particular, we apply the mean and standard deviation scaling method so that each input has a mean of 0 and a standard deviation of 1.
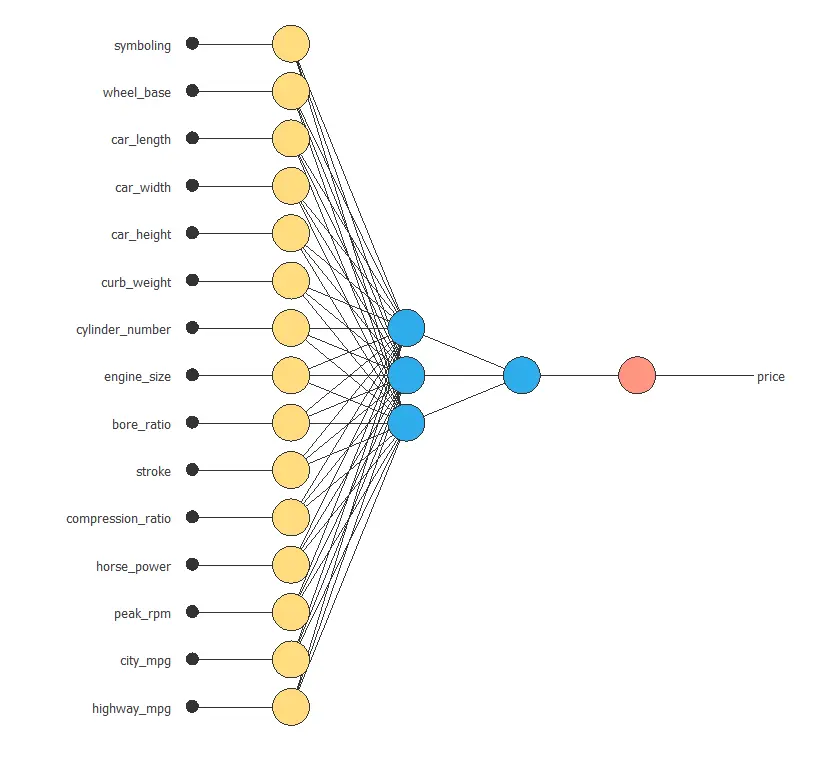
Next, we add two perceptron layers to the network. In most cases, this structure provides sufficient modeling capacity. The first layer receives 15 inputs and contains 3 neurons, while the second layer takes those 3 outputs as inputs and includes 1 neuron.
Finally, the unscaling layer converts the normalized network output back into the original price scale. In this case, we also use the mean and standard deviation scaling method.
The next figure shows the resulting network architecture.
4. Training strategy
The next step involves selecting an appropriate training strategy to define what the neural network will learn. In general, a training strategy consists of two main components:
A loss index
An optimization algorithm
First, we choose the loss index. In this case, we select the normalized squared error with L1 regularization. Although the default configuration for approximation problems includes L2 regularization, we obtain a lower selection error using L1 regularization. Therefore, we adopt this alternative to improve generalization.
Next, we select the optimization algorithm. Here, we use the quasi-Newton method, which is the default choice for medium-sized applications like this one. In practice, this algorithm provides a good balance between convergence speed and stability.
Once we define the training strategy, we proceed to train the neural network. The following chart illustrates how both the training error (blue) and the selection error (orange) decrease as the number of training epochs increases.
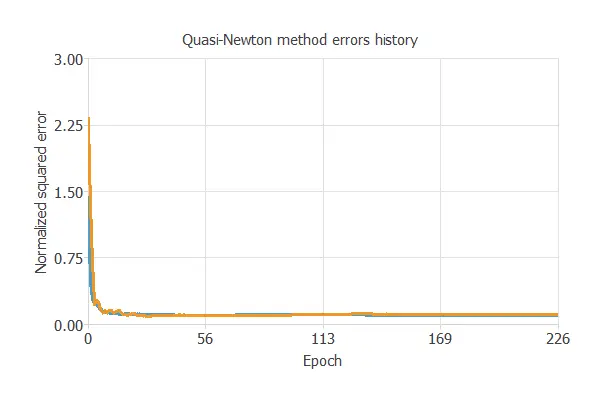
The most important training result is the final selection error. Indeed, this is a measure of the generalization capabilities of the neural network. Here, the final selection error is Selection error = 0.109 NSE.
5. Model selection
The objective of model selection is to identify the network architecture with the best generalization properties. In particular, we aim to improve the previous selection error of 0.209 (NSE).
To achieve this, we search for a model whose complexity appropriately balances data fit and predictive performance. Therefore, order selection algorithms determine the optimal number of perceptrons in the neural network.
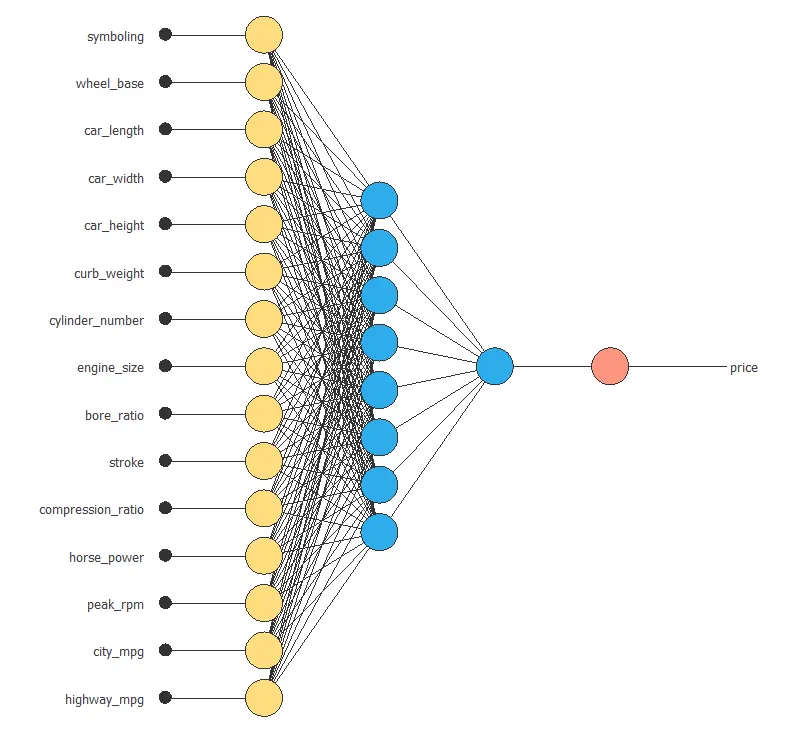
As expected, the training error consistently decreases as we increase the number of neurons. However, the selection error does not follow the same pattern. Instead, it reaches a minimum at a specific point. In this case, the optimal configuration includes 8 neurons, which yields a selection error of 0.0974.
The following figure illustrates the optimal network architecture for this application.
6. Testing analysis
The objective of the testing analysis is to validate the generalization performance of the trained neural network. In other words, this phase evaluates how well the model performs on unseen data. During this stage, we compare the predicted values with the observed values to assess accuracy.
For approximation problems, a common evaluation method consists of performing a linear regression analysis between the predicted and actual values using an independent testing set. As a result, we can quantify the strength of the relationship between both sets of values. The next figure illustrates the graphical output generated by this testing analysis.
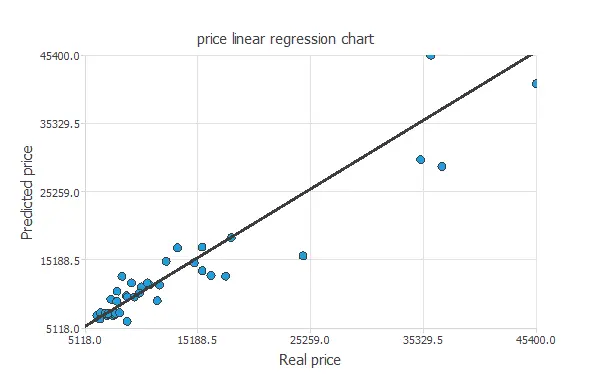
From the above chart, we can see that the neural network is predicting the entire range of car price data well. The correlation value is R2 = 0.937, indicating the model has a reliable prediction capability.
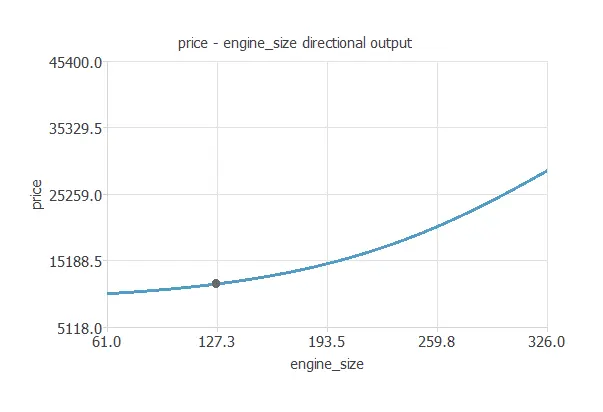
7. Model deployment
The model is now ready to estimate the price of a specific car with satisfactory accuracy within the same data range. Therefore, we can use it to analyze how different features influence pricing.
- symboling: 2
- fuel_type: “Diesel”.
- aspiration: “turbo”.
- drive_wheel: “rwd”.
- wheel_base: 98.8 in.
- car_length: 174 in.
- car_width: 65.9 in.
- car_height: 53.7 in.
- curb_weight: 2560 lb.
- engine_type: “dohc”.
- cylinder_number: 4.
- engine_size: 127 cc.
- bore_ratio: 3.33.
- stroke: 3.26 in.
- compression_ratio: 10.1.
- horse_power: 104 hp.
- peak_rpm: 5130 rpm.
- city_mpg: 25.2 mpg.
- highway_mpg: 30.8 mpg.
The car_price.py contains the Python code for the car price.
References
- Kaggle Machine Learning Repository. Car Price Assignment Data Set.