Sales forecast is an essential task for managing a store, and machine learning can help us discover the factors that influence sales in a retail store and estimate the number of sales in the near future. In this post, we use historical sales data of a drugstore chain to predict its sales up to one week in advance.
Contents
You can follow the step-by-step construction of this predictive model by downloading the free trial of the data science and machine learning platform Neural Designer.
Data analysis
The first step of the analysis is to study the data set, which contains the sales information from the drug stores.
The following time series chart shows the number of sales by month.
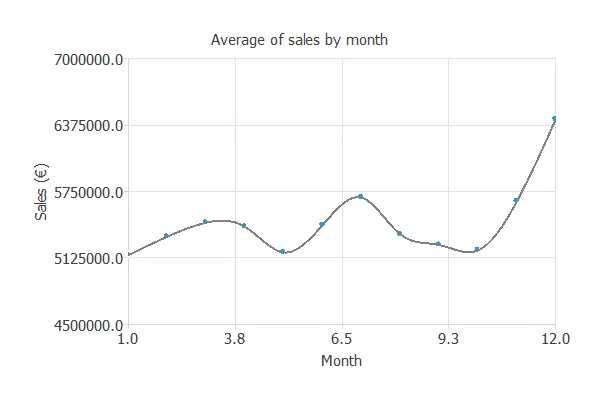
As we can see, the number of sales peaks in July and more so in December. The months with the most minor sales are January, May, and October.
The following chart shows the distribution of sales throughout the month.
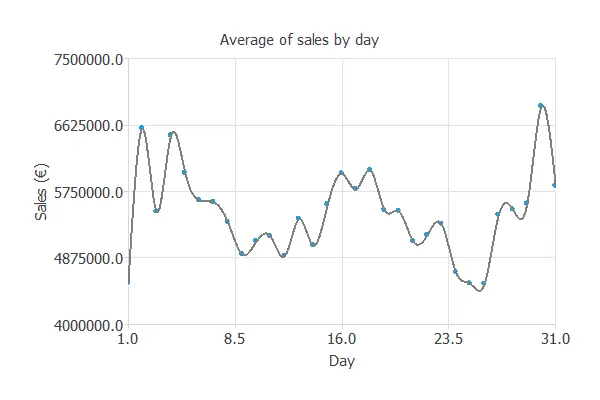
In this case, the days of the month’s beginning and end have higher activity. Around the middle of the month, there is a smaller peak.
It is also essential to look at the number of sales by weekday. The following time series chart shows the sales in these shops from Monday (1) to Sunday (7).
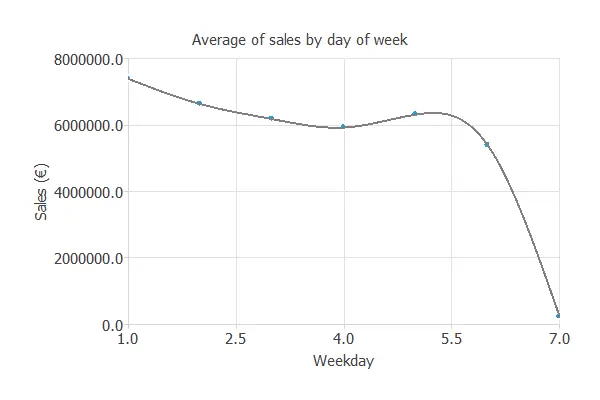
Monday is the day preferred by the customers to buy in these retail shops. During the rest of the week, the sales decrease from Monday to Thursday and increase on Friday. On Sunday, there is a sharp descent in the number of sales. This is because most of the shops in this drugstore chain are closed on this day.
The next step is to select and prepare the variables we will use.
The following list shows the input variables or predictands:
- Day of the month.
- Month.
- Day of the week.
- Promotion.
- State holidays.
- School holidays.
- Sales of the 7 previous days.
- Promotions of the 7 previous days.
In total, the number of inputs is 20.
The target variable, or predictor, is:
- Sales of the next seven days.
This is the information that we want to predict with our model.
Model training
After defining the variables we will use for the analysis, it is time to use Neural Designer to build the predictive model for the sales of the stores.
The following image shows a representation of the neural network that we use for the predictive analysis.
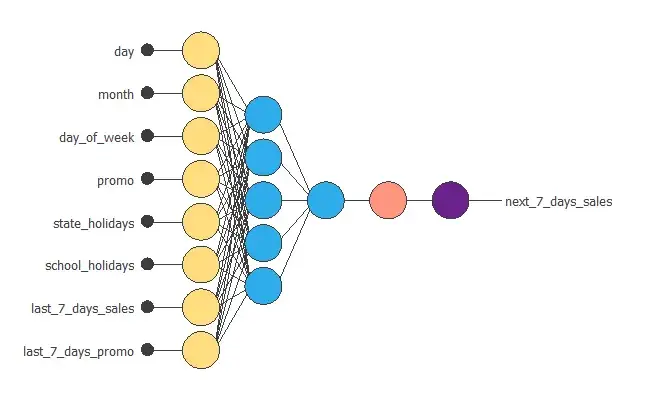
The information on the previous week’s date, promos, holidays, and sales enters the neural network through the left layer.
Then, it is analyzed by perceptrons in the middle layer to find the patterns that determine the number of sales given by the last layer.
Now, the neural network is ready to be trained using the Quasi-Newton algorithm. To find more information about this and other optimization algorithms, you can read 5 algorithms to train a neural network.
Testing analysis
Before using the model to forecast the sales, the last step is to determine its predictive power on an independent data set that has not been used before for the training. The following chart shows the linear regression analysis between the scaled output of the neural network and the corresponding scaled targets.
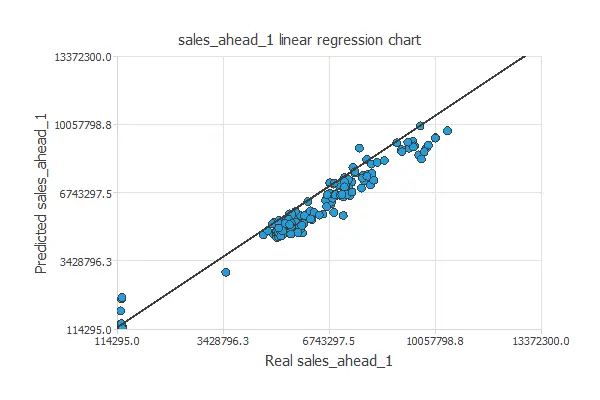
The previous linear regression analysis gives us a correlation coefficient of 0.976 and a slope close to 1. This means the model is predicting well this set of data.
Consequently, the model is ready to be moved to the deployment phase.
Model deployment
Once we have tested the model, we can predict the shop’s sales one week in advance. We introduce the data from the current week as input, and we will obtain the expected sales for each day of the following week.
In the following chart, there is a comparison between the predicted sales applying a promotion or not. The blue line represents the number of sales the model predicts without a promotion,
and the orange line is with a promotion. We can see that there is a significant increase.
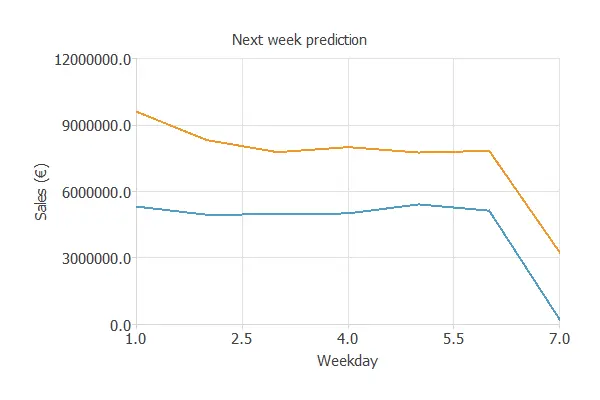
As we can see, next week’s Monday is when most sales are expected.
During the rest of the week, the number of sales will remain stable, and they will decrease on Sunday because of the closing of most stores.
Conclusions
In this post, we have developed a predictive model that can help retailers determine the number of sales they will make in the future.
Using this model, retailers can plan the number of products they need. As a consequence, the system will allow them to increase their profits.