Introduction
Machine learning has improved early detection and clinical decision-making in liver disease.
Conditions such as Hepatitis C, Fibrosis, and Cirrhosis are common and can lead to serious complications if not detected early. Diagnosis often requires integrating multiple blood and urine biomarkers.
We implemented a neural network model using patient data and biochemical markers to classify stages of liver disease.
Trained with the Medical University of Hannover dataset, the model achieved high accuracy, showing potential as a diagnostic support tool.
Healthcare professionals can test this methodology by downloading Neural Designer’s.
Contents
The following index outlines the steps for performing the analysis.
1. Model type
- Problem type: Multiclass classification (no disease, suspect disease, hepatitis C, fibrosis, cirrhosis)
- Goal: Model the probability of each liver condition based on patient tests, including blood and urine analyses, to support clinical decision-making.
2. Data set
Data source
The dataset hvcdat.csv includes 615 instances (rows) and 13 variables (columns), with target values: no disease, suspect disease, Hepatitis C, Fibrosis, or Cirrhosis.
Variables
The following list summarizes the variables’ information:
Patient information
age (-Age of the patient in ) – years. Normal ranges may vary depending on age.
sex (f or m) – Sex of the patient. Normal ranges for some blood tests differ by sex.
Blood test variables
albumin (34-54 g/L) – Low levels may indicate liver disease (Hepatitis, Cirrhosis) or kidney disease.
alkaline_phosphatase (40-129 U/L) – Elevated levels may indicate liver damage, bile duct obstruction, or other liver conditions.
alanine aminotransferase (ALT, 7-55 U/L) – Enzyme primarily found in the liver. High levels suggest liver injury from Hepatitis, Cirrhosis, or other liver diseases.
aspartate aminotransferase (AST, 8-48 U/L) – An enzyme present in the liver and muscles. Elevated AST can indicate liver disease, hepatitis, or cirrhosis.
bilirubin (1-12 mg/L) – A yellow pigment formed from red blood cell breakdown. High levels indicate liver disease or bile obstruction.
cholinesterase (8-18 U/L) – Enzyme synthesized by the liver. Low levels are associated with chronic liver disease.
cholesterol (<5.2 mmol/L) – Low or high levels can indicate liver dysfunction or metabolic disorders.
creatinine (M: 61.9-114.9
µmol/L; F: 53-97.2µmol/L) – Indicator of kidney function. Abnormal levels may indicate complications of liver disease that affect renal function.gamma-glutamyl transferase (GGT, 0-30/50 IU/L) – Enzyme indicative of cholestasis and liver damage. Higher levels suggest greater liver injury.
protein (<80mg) – Total protein level; abnormal levels may indicate liver or kidney dysfunction.
Target variable
diagnose: No disease, Suspect disease, Hepatitis C, Fibrosis, or Cirrhosis.
Instances
The dataset’s instances are split into training (60%), validation (20%), and testing (20%) subsets by default.
You can adjust them as needed.
Variables distributions
We can examine variable distributions; the figure shows the number of patients with and without liver disease in the dataset.
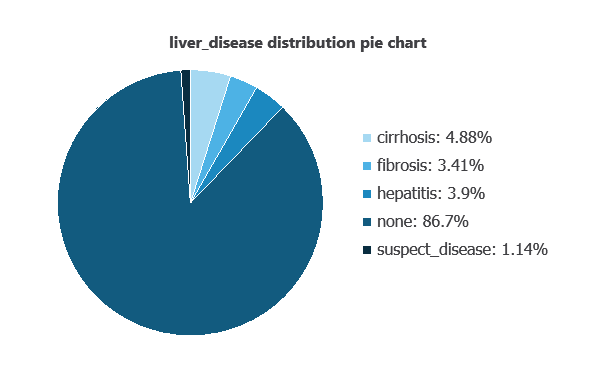
As depicted in the image, 86.7% of patients show no liver disease, while 4.88% have cirrhosis, 3.41% have fibrosis, 3.9% have hepatitis, and 1.14% are suspected of having liver disease.
Input-target correlations
The input-target correlations indicate which clinical and demographic factors most influence the presence or absence of liver disease, and therefore are more relevant to our analysis.
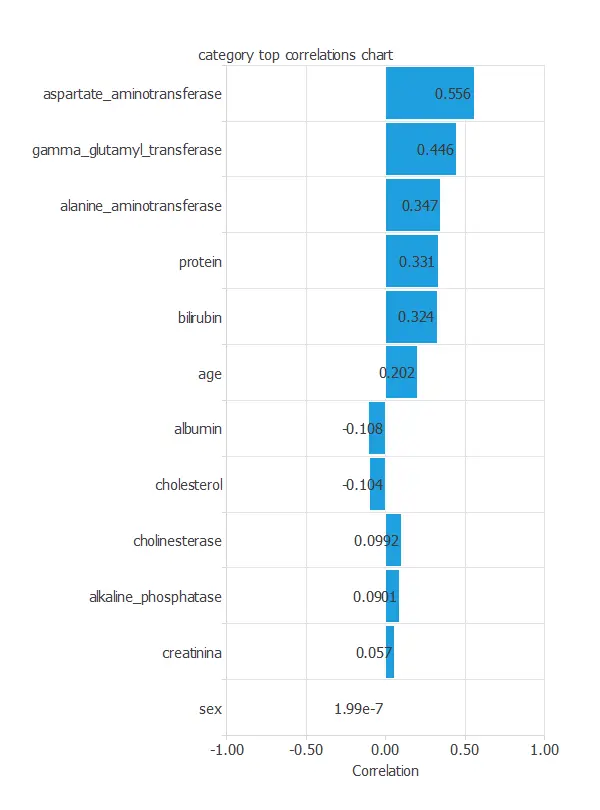
Here, the most correlated variables with malignant tumors are aspartate aminotransferase, gamma glutamyl transferase, and alanine aminotransferase.
3. Neural network
A neural network is an artificial intelligence model inspired by how the human brain processes information.
It is organized in layers: the input layer receives the variables, the hidden layer combines them to detect relevant patterns, and the output layer provides the probability of belonging to a given class.
Trained with historical data, the network learns to recognize patterns and distinguish between categories, offering objective support for decision-making.
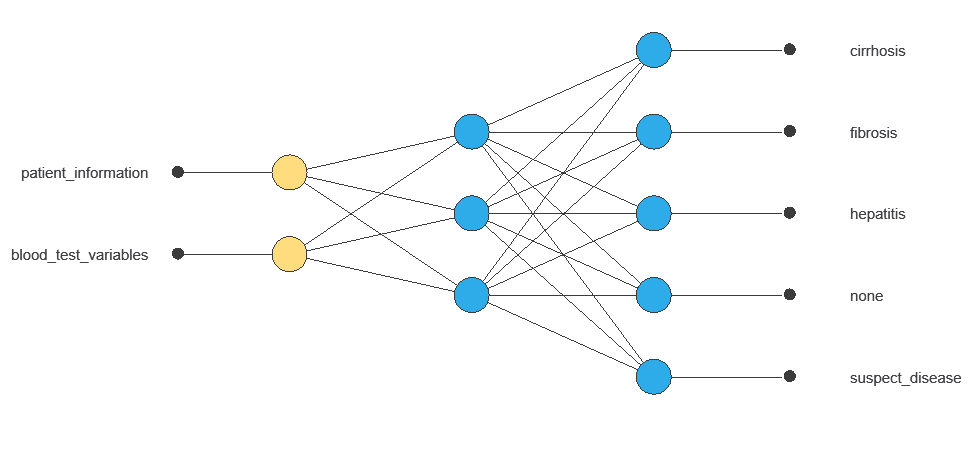
The network uses twelve diagnostic variables to produce five outputs (no disease, suspect disease, hepatitis, fibrosis, cirrhosis), with connections showing each variable’s contribution.
4. Training strategy
Training a neural network uses a loss function and optimization algorithm to learn from data while avoiding overfitting, ensuring good performance on both training and new cases.
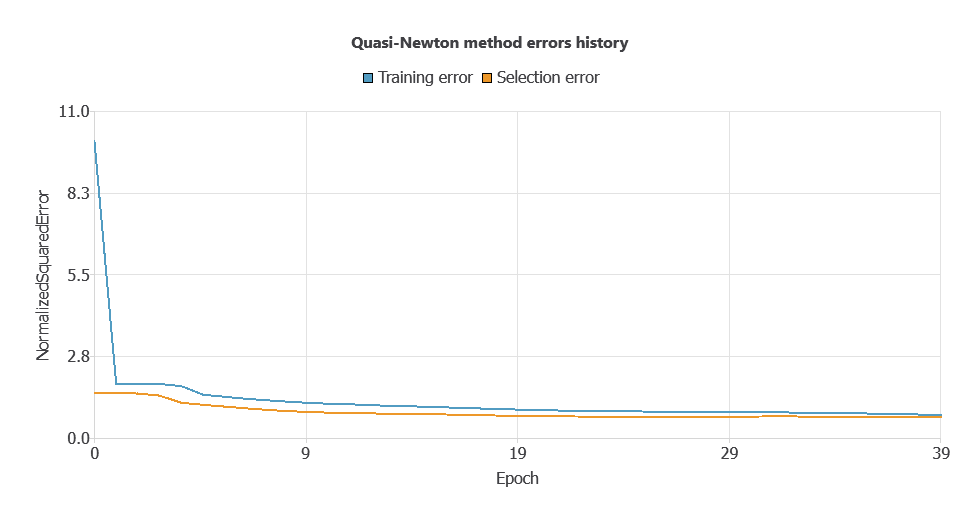
The model was trained to ensure accuracy and stability, with steadily decreasing training and selection errors (0.0553 and 0.0557 WSE), demonstrating effective learning and strong generalization.
5. Testing analysis
Once the model is trained, we perform a testing analysis to validate its prediction capacity.
We use a subset of previously unused data, specifically the testing instances.
Confusion matrix
The confusion matrix shows the model’s performance by comparing predicted and actual outcomes. It includes:
True positives: patients correctly predicted to have liver disease
False positives: patients incorrectly predicted to have liver disease
False negatives: patients incorrectly predicted not to have liver disease
True negatives: patients correctly predicted not to have liver disease
| Predicted no disease | Predicted suspect disease | Predicted hepatitis c | Predicted fibrosis | Predicted cirrhosis | |
|---|---|---|---|---|---|
| Real no disease | 107 | 1 | 0 | 1 | 0 |
| Real suspect disease | 0 | 0 | 0 | 0 | 0 |
| Real hepatitis c | 5 | 0 | 1 | 1 | 1 |
| Real fibrosis | 0 | 0 | 1 | 2 | 0 |
| Real cirrhosis | 1 | 0 | 0 | 0 | 2 |
In this example, 91.06% of cases were correctly classified and 8.94% were misclassified.
6. Model deployment
After confirming the neural network’s ability to generalize, the model can be saved for future use in deployment mode.
This allows the trained network to be applied to new patients, using their clinical variables to calculate the probability of liver disease.
In deployment mode, healthcare professionals can use the model as a reliable diagnostic support tool for classifying new patients.
The Neural Designer software exports the trained model automatically, making it easy to integrate into clinical practice.
Conclusions
The liver disease machine learning model, trained with the Medical University of Hannover dataset, performed highly in classifying patients as no disease, suspected disease, Hepatitis C, Fibrosis, or Cirrhosis.
Key variables—AST, GGT, and ALT—are consistent with established clinical indicators, supporting the model’s reliability.
This tool can assist healthcare professionals in early detection, complementing clinical evaluations and improving diagnostic accuracy.
References
- The data for this problem has been taken from the UCI Machine Learning Repository.
- Lichtinghagen R et al. J Hepatol 2013; 59: 236-42.
- Hoffmann G et al. Using machine learning techniques to generate laboratory diagnostic pathways a case study. J Lab Precis Med 2018; 3: 58-67.