
Separate simulated gamma-ray showers from hadronic background
This reproducible benchmark maps ten image descriptors from a simulated imaging atmospheric Cherenkov telescope to a hadron-class score. On 3,804 held-out events, the final model reaches an ROC AUC of 0.935. At the default score threshold of 0.50 it retains 90.2% of gamma events while rejecting 82.8% of hadronic background.
1. Scientific objective
The task is to rank telescope-camera events by how compatible their image morphology is with hadronic background. Events with a low hadron-class score are gamma-like candidates. This is an event-selection benchmark for simulated data; it is not a source detection, a flux measurement or evidence of a gamma-ray signal.
Reduce the background passed to downstream source and spectral analyses while retaining a controlled fraction of gamma events.
Choose a score threshold from the required gamma efficiency and accepted hadron leakage instead of optimizing accuracy alone.
Inspect the exact split, model, regenerated analyses and executable Python export used for the reported results.
2. Data and provenance
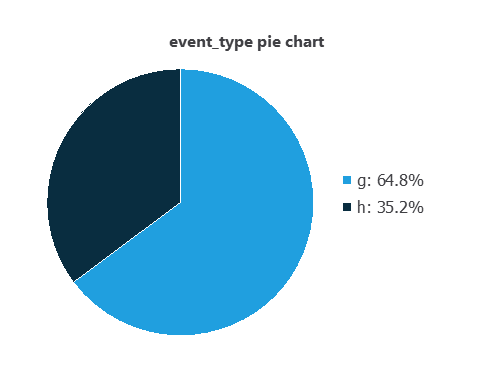
The MAGIC Gamma Telescope data set contains 19,020 simulated events with no missing values: 12,332 gamma events (g) and 6,688 hadronic-background events (h). The examples were generated with CORSIKA and processed into approximately triggered camera images.
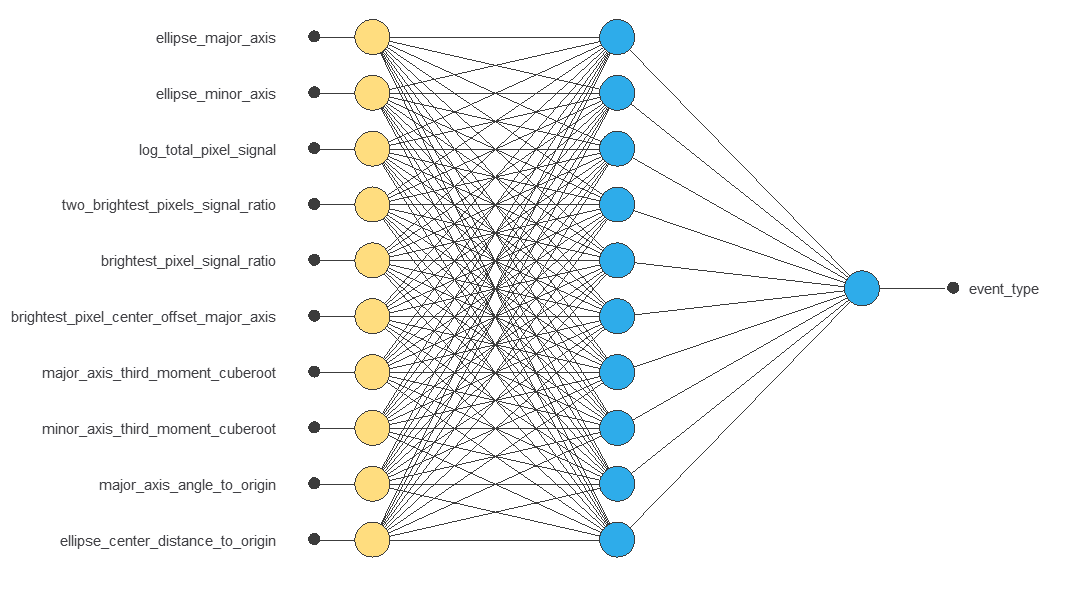
The analysis uses the following ten input fields exactly as they appear in the downloadable CSV and the exported model.
| CSV field | Physical meaning | Unit or scale |
|---|---|---|
ellipse_major_axis | Major-axis extent of the shower image | mm |
ellipse_minor_axis | Minor-axis extent of the shower image | mm |
log_total_pixel_signal | Base-10 logarithm of total pixel content | log signal |
two_brightest_pixels_signal_ratio | Signal fraction in the two brightest pixels | ratio |
brightest_pixel_signal_ratio | Signal fraction in the brightest pixel | ratio |
brightest_pixel_center_offset_major_axis | Projected brightest-pixel offset along the major axis | mm |
major_axis_third_moment_cuberoot | Cube root of the third moment along the major axis | mm |
minor_axis_third_moment_cuberoot | Cube root of the third moment along the minor axis | mm |
major_axis_angle_to_origin | Major-axis angle to the image origin | degrees |
ellipse_center_distance_to_origin | Image-centroid distance to the origin | mm |
| Subset | Rows | Purpose |
|---|---|---|
| Training | 11,412 | Estimate model parameters |
| Selection | 3,804 | Select the hidden-layer size |
| Testing | 3,804 | Report final performance once |
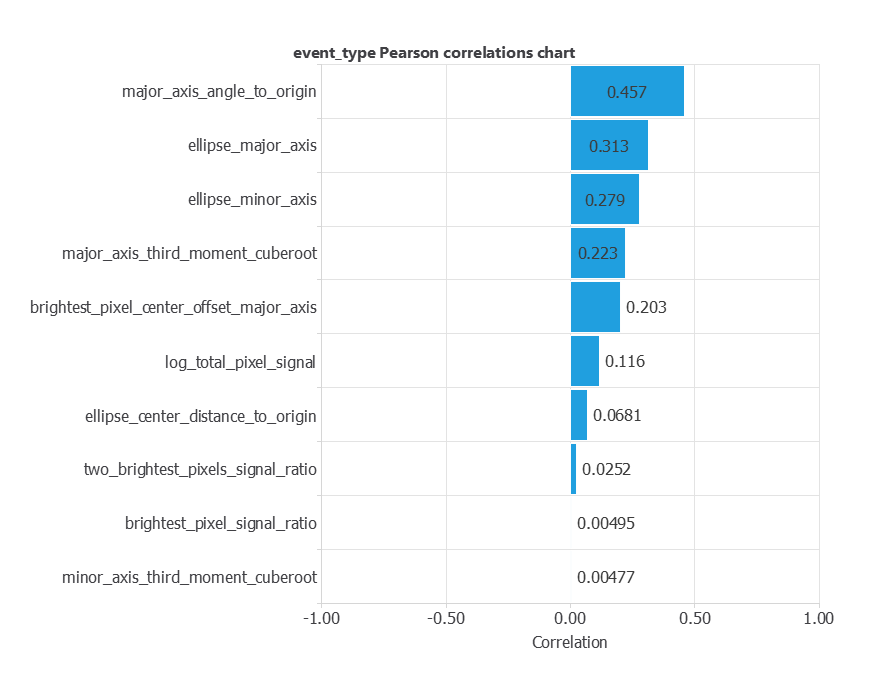
g=0, h=1), not causal importance measures. The nonlinear model can use interactions that Pearson correlation does not show.3. Model
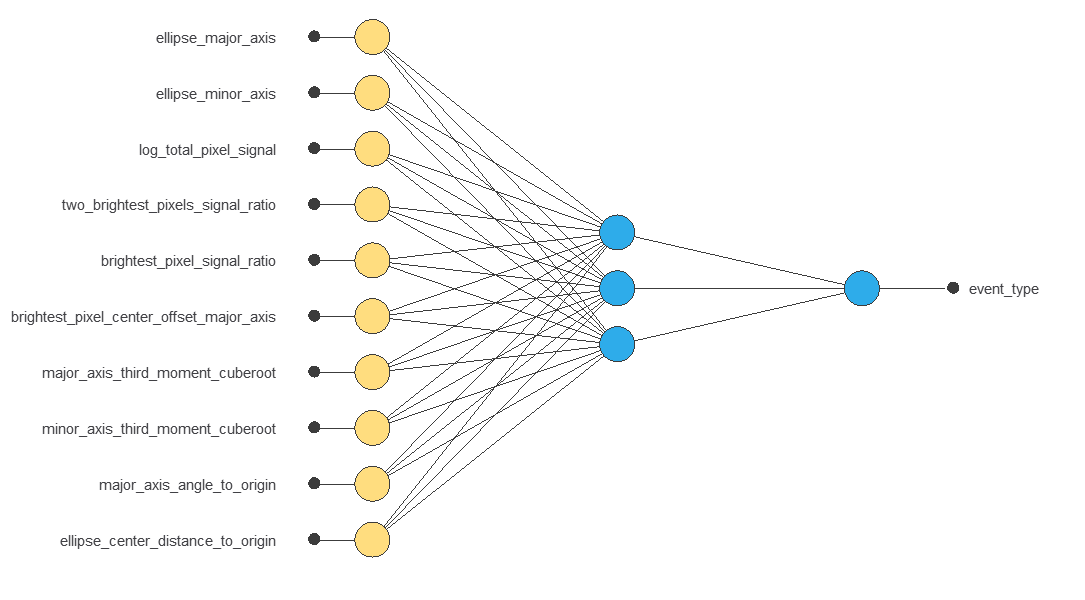
All ten inputs use mean-and-standard-deviation scaling. The initial network has three tanh neurons in one hidden layer and one sigmoid output, for 37 trainable parameters. This is the baseline architecture trained before the hidden-layer size is evaluated.
The output class ordering is g;h, so the sigmoid value is the score for h, the hadronic-background class.
4. Training strategy
The loss is weighted squared error. The gamma class receives weight 0.7712 and the less frequent hadron class weight 1.4219, so training does not simply follow the simulated class prevalence. A quasi-Newton optimizer estimates the parameters without explicit regularization.
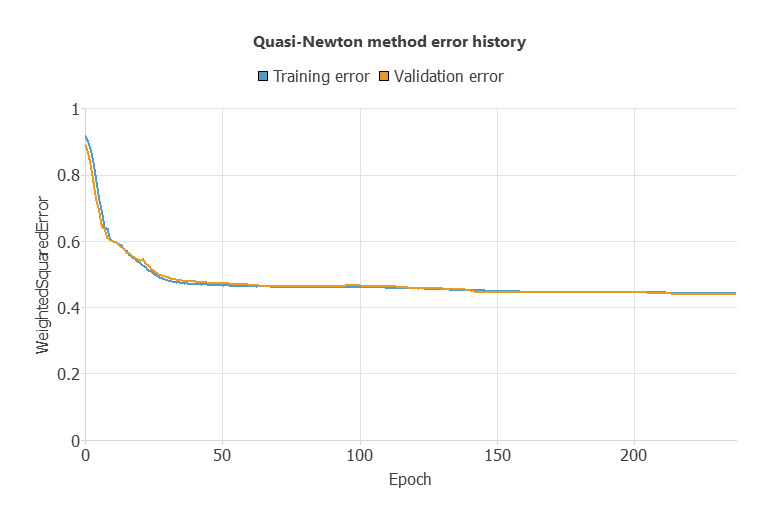
The initial three-neuron network converged in 237 epochs: training error decreased from 0.9177 to 0.4444 and selection error from 0.8921 to 0.4404.
5. Model selection and baseline
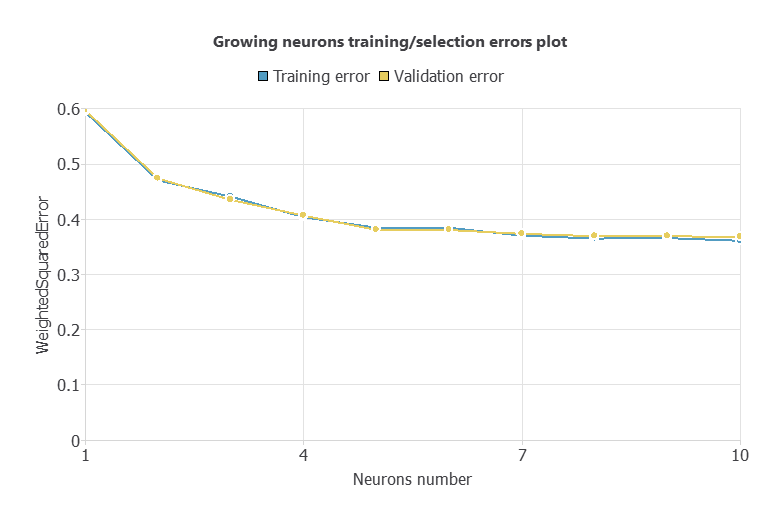
Growing-neurons selection evaluated hidden layers from one to ten neurons. The lowest stored selection error, 0.3677, occurred at ten neurons; its training error was 0.3610. The final architecture is therefore 10–10–1.
Selected architecture
After neuron selection, the hidden layer expands from three to ten tanh neurons. This 10–10–1 network contains 121 trainable parameters and is the model used for testing, deployment and the downloadable Python export.
| Reference | ROC AUC | Interpretation |
|---|---|---|
| Random ranking | 0.500 | No class-separation ability |
| Final neural network | 0.935 | Strong event ranking on the held-out simulation |
6. Scientific validation
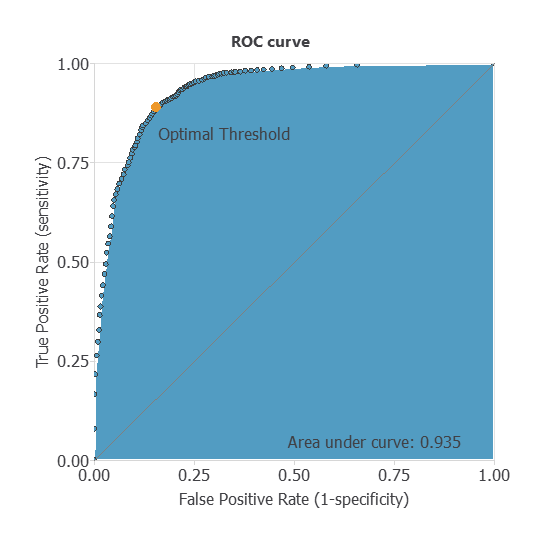
Testing uses 2,466 gamma events and 1,338 hadron events that were not used for parameter estimation or neuron selection. Because a hadron accepted as gamma contaminates the candidate sample, threshold selection is reported as gamma efficiency versus hadron rejection rather than relying on accuracy alone.
| Testing metric | Value | Meaning |
|---|---|---|
| ROC AUC | 0.935 | Probability that a random hadron receives a higher hadron score than a random gamma event |
| Gamma efficiency at score 0.50 | 90.2% | Gamma events retained as gamma-like |
| Hadron rejection at score 0.50 | 82.8% | Hadron events rejected from the gamma-like sample |
| Hadron leakage at score 0.50 | 17.2% | Hadron events incorrectly admitted as gamma-like |
| Accuracy at score 0.50 | 87.6% | Supplementary metric under the simulated class mixture |
Confusion matrix at hadron score 0.50
| Actual / predicted | Gamma-like | Hadron-like | Total |
|---|---|---|---|
| Gamma | 2,224 | 242 | 2,466 |
| Hadron | 230 | 1,108 | 1,338 |
| Total | 2,454 | 1,350 | 3,804 |
Choose the threshold from the scientific objective
| Hadron-score threshold | Gamma efficiency | Hadron rejection | Hadron leakage |
|---|---|---|---|
| 0.50 | 90.2% | 82.8% | 17.2% |
| 0.30 | 78.3% | 90.4% | 9.6% |
| 0.19 | 65.6% | 95.0% | 5.0% |
| 0.05 | 29.8% | 99.0% | 1.0% |
7. Inference and reproducibility
A credible workflow starts from reconstructed camera images, calculates the same ten descriptors, validates schema and ranges, evaluates the hadron-class score, and applies a threshold chosen for the analysis. Selected gamma-like candidates then enter spatial, temporal or spectral inference with exposure and systematic uncertainties.
Representative simulated event
The following point is inside every training range and demonstrates the exported calculation. It is not a recorded telescope event.
| Input | Value |
|---|---|
| Ellipse major axis | 65 mm |
| Ellipse minor axis | 49 mm |
| Log total pixel signal | 3.20 |
| Two-brightest-pixel ratio | 0.26 |
| Brightest-pixel ratio | 0.14 |
| Brightest-pixel major-axis offset | −36 mm |
| Major-axis third-moment cube root | 46 mm |
| Minor-axis third-moment cube root | 28 mm |
| Major-axis angle to origin | 78° |
| Ellipse-centre distance to origin | 320 mm |
At threshold 0.50, the event is classified as hadron-like and excluded from the gamma-like candidate sample.
Reproduce the inference
The Python package contains the exact exported model, ordered input schema, representative case and expected output. It was executed over all 3,804 testing events and reproduced the Neural Designer confusion matrix and ROC AUC. The project package preserves the split, trained parameters and regenerated analyses.
from model import NeuralNetwork

inputs = [65, 49, 3.2, 0.26, 0.14, -36, 46, 28, 78, 320]
hadron_score = NeuralNetwork().calculate_outputs(inputs)[0]8. Validity, uncertainty and limitations
- Simulation-to-data transfer is untested. The benchmark uses CORSIKA-generated events and does not validate detector response, atmospheric conditions or image cleaning on recorded observations.
- The public prevalence is artificial. Gamma events are 64.8% of this table, whereas real observations contain substantially more hadronic background. Accuracy and sample purity therefore do not transfer directly.
- Energy dependence is hidden. The public CSV has no event-energy column, so performance cannot be reported in the energy bins used in the source study.
- Validation is row-random. Thirty testing feature vectors (0.79%) duplicate a training vector. A stricter benchmark would group or remove duplicates before partitioning and would validate by simulation or observation run.
- The score is not calibrated. It is a ranking score for class
h, not a posterior gamma probability. Any probabilistic use requires independent calibration under representative class priors. - The selection boundary was reached. Ten neurons produced the lowest selection error among the tested sizes but was also the configured maximum.
- Scientific discovery requires more. Exposure, event weights, control regions, systematic uncertainties and a likelihood-based significance analysis are outside this example.
References
- UCI Machine Learning Repository: MAGIC Gamma Telescope, DOI 10.24432/C52C8B, CC BY 4.0.
- R. K. Bock et al., Methods for multidimensional event classification: a case study using images from a Cherenkov gamma-ray telescope, Nuclear Instruments and Methods in Physics Research A 516 (2004), 511–528.
- D. Heck et al., CORSIKA: a Monte Carlo code to simulate extensive air showers.