
Separate simulated Higgs-signal events from background with a compact neural classifier
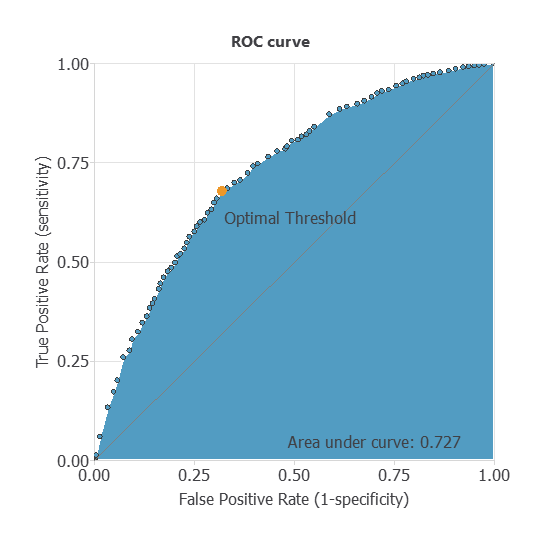
This reproducible benchmark maps 28 normalized event descriptors to a binary classification score. On 2,002 held-out simulated events, the model reaches an ROC AUC of 0.727. The result demonstrates multivariate event ranking; it is not evidence for a particle discovery or a production LHC analysis.
1. Scientific objective
The task is binary classification of simulated proton–proton collision events: rank a benchmark signal process above a simulated top-quark background using reconstructed kinematic and derived mass features. The useful output is a discriminant score for downstream statistical analysis, not a stand-alone statement that an individual event contains a Higgs boson.
Event prioritization
Rank simulated events so analysts can define signal-enriched and control regions.
Operating-point studies
Compare signal efficiency with background rejection before selecting an analysis threshold.
Reproducible benchmark
Inspect the complete preprocessing, network, split and exported inference implementation.
2. Data and provenance
The original UCI HIGGS data set contains 11 million Monte Carlo events. This example uses 10,012 rows: 6,008 for training, 2,002 for model selection and 2,002 for testing. The benchmark signal and background were generated with MadGraph5, showered with PYTHIA and passed through the DELPHES fast detector simulation, as documented in the original study.
| Feature group | Count | Contents | Representation here |
|---|---|---|---|
| Lepton kinematics | 3 | pT, pseudorapidity η and azimuth φ | Normalized benchmark values |
| Missing transverse energy | 2 | Magnitude and azimuth φ | Normalized benchmark values |
| Four leading jets | 16 | pT, η, φ and b-tag discriminant per jet | Normalized benchmark values |
| Derived mass features | 7 | M_jj, M_jjj, M_lv, M_jlv, M_bb, M_wbb and M_wwbb | Normalized benchmark values |
| Target | 1 | Event = 1 for signal; Event = 0 for background | Binary label |
| Subset | Events | Purpose |
|---|---|---|
| Training | 6,008 | Fit network parameters |
| Selection | 2,002 | Monitor generalization and stopping |
| Testing | 2,002 | Final performance estimates |
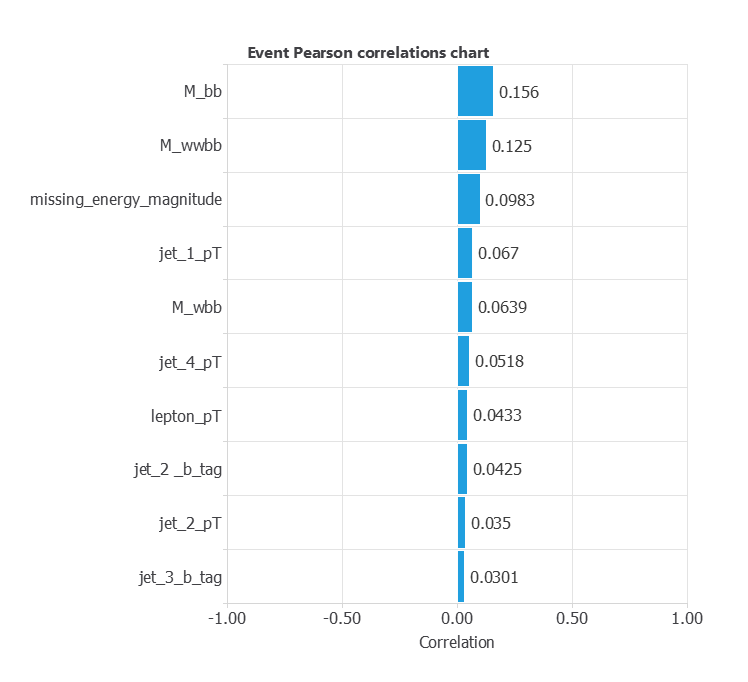
jet_2_b_tag, jet_3_pT and jet_4_phi.3. Model
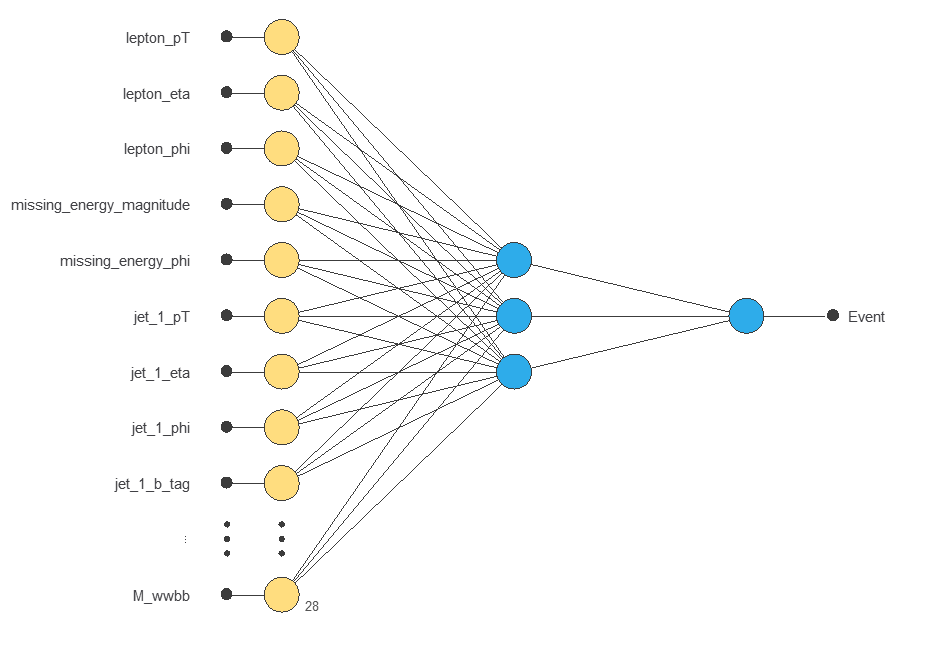
The network receives the 28 continuous descriptors through a mean-and-standard-deviation scaling layer. One dense hidden layer contains three tanh neurons, followed by a single sigmoid output named Event.
The sigmoid value is a classification score. No probability-calibration analysis is available in this project, so the value should not be reported as a calibrated probability that an event is signal.
4. Training strategy
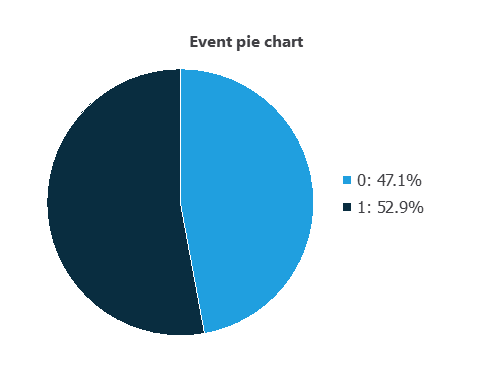
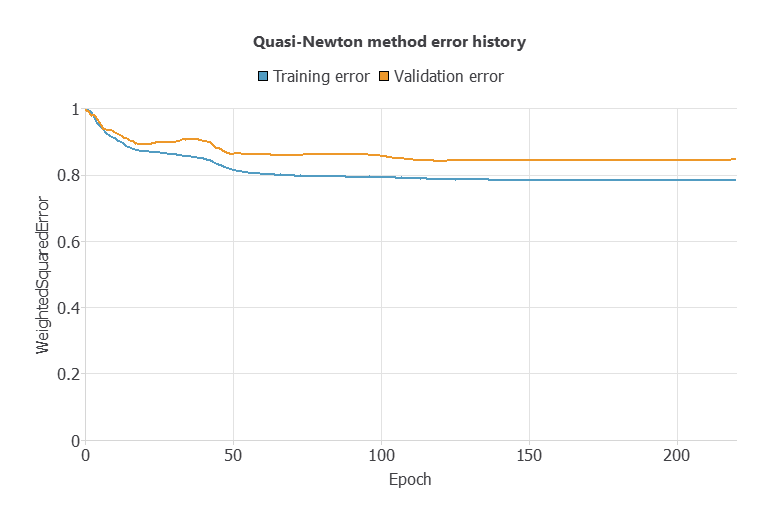
The project minimizes a weighted squared error with no regularization. Class weights are 0.9445 for signal and 1.0624 for background, compensating for the small class imbalance. The Quasi-Newton optimizer stops after 221 epochs when the selection error has exceeded its improvement allowance.
| Training result | Value |
|---|---|
| Final training error | 0.786 |
| Final selection error | 0.848 |
| Epochs completed | 221 |
| Stopping condition | Maximum selection-error increases |
5. Model selection and baseline
The project contains configurations for growing-input and growing-neuron searches, but no completed selection sweep is stored in the regenerated output. The three-neuron architecture is therefore reported as the final compact baseline, not as a demonstrated optimum.
6. Scientific validation
All headline metrics below come from the untouched 2,002-event testing subset. The ROC analysis reports an AUC of 0.727 with a 95% confidence interval from 0.709 to 0.745.
| Testing metric | Value | Interpretation |
|---|---|---|
| ROC AUC | 0.727 | Moderate ranking discrimination |
| Accuracy at threshold 0.50 | 67.5% | 1,352 of 2,002 events classified correctly |
| Precision at threshold 0.50 | 71.5% | Signal fraction among predicted-positive events |
| Signal efficiency at threshold 0.50 | 66.7% | 724 of 1,086 simulated signal events retained |
| Background rejection at threshold 0.50 | 68.6% | 628 of 916 simulated background events rejected |
| F1 score at threshold 0.50 | 69.0% | Balance of precision and signal efficiency |
Confusion matrix at the default 0.50 threshold
| Actual / predicted | Signal | Background | Total |
|---|---|---|---|
| Signal | 724 | 362 | 1,086 |
| Background | 288 | 628 | 916 |
| Total | 1,012 | 990 | 2,002 |
7. Inference and reproducibility
A credible inference workflow validates the 28-feature schema, applies the exported preprocessing and model, stores the score alongside the event identifier and model version, and lets the physics analysis define score regions. The score is one input to a statistical procedure, never the final scientific conclusion.
Reproduce the calculation
The Python package contains the corrected 28-input export, an explicit ordered schema and a README. The Neural Designer project preserves the split, trained parameters and regenerated analysis. The repaired Python export was executed over all 2,002 testing events and reproduced the Neural Designer confusion matrix exactly, with AUC 0.727335.
from model import NeuralNetwork

model = NeuralNetwork()
score = model.calculate_outputs(event_features)[0]8. Validity, uncertainty and limitations
- Simulation-to-data transfer is untested. MadGraph5, PYTHIA and DELPHES cannot represent every detector and modelling uncertainty present in recorded data.
- This is a small educational subset. It does not use the canonical large-scale HIGGS benchmark split, and results can vary with the sampled rows and random partition.
- Thresholds are analysis-dependent. Class balance and equal-error operation do not encode the background rates, event weights or costs of a collider analysis.
- Calibration is absent. The sigmoid score has not been checked with reliability curves, Brier score or calibration on independent data.
- Architecture optimality is unproven. No stored completed model-selection sweep or classical baseline comparison supports the final three-neuron choice.
- Uncertainty is incomplete. The AUC confidence interval covers test-sample uncertainty only; systematic uncertainties, nuisance parameters and analysis significance are outside this example.
References
- UCI Machine Learning Repository: HIGGS data set (DOI: 10.24432/C5V312; CC BY 4.0).
- P. Baldi, P. Sadowski and D. Whiteson, Searching for exotic particles in high-energy physics with deep learning, Nature Communications 5, 4308 (2014).
- CERN: The Higgs boson, including the 4 July 2012 discovery announcement.